Protein Synthesis Diagram: A Step-by-Step Visual Guide to Translation and Transcription
In this guide you will discover how to read and interpret the most common diagrams that illustrate protein synthesis, from DNA transcription to mRNA translation. By the end, you’ll understand each step, the role of cellular machinery, and how the visual elements in these diagrams represent the underlying biological processes.
Overview of Protein Synthesis
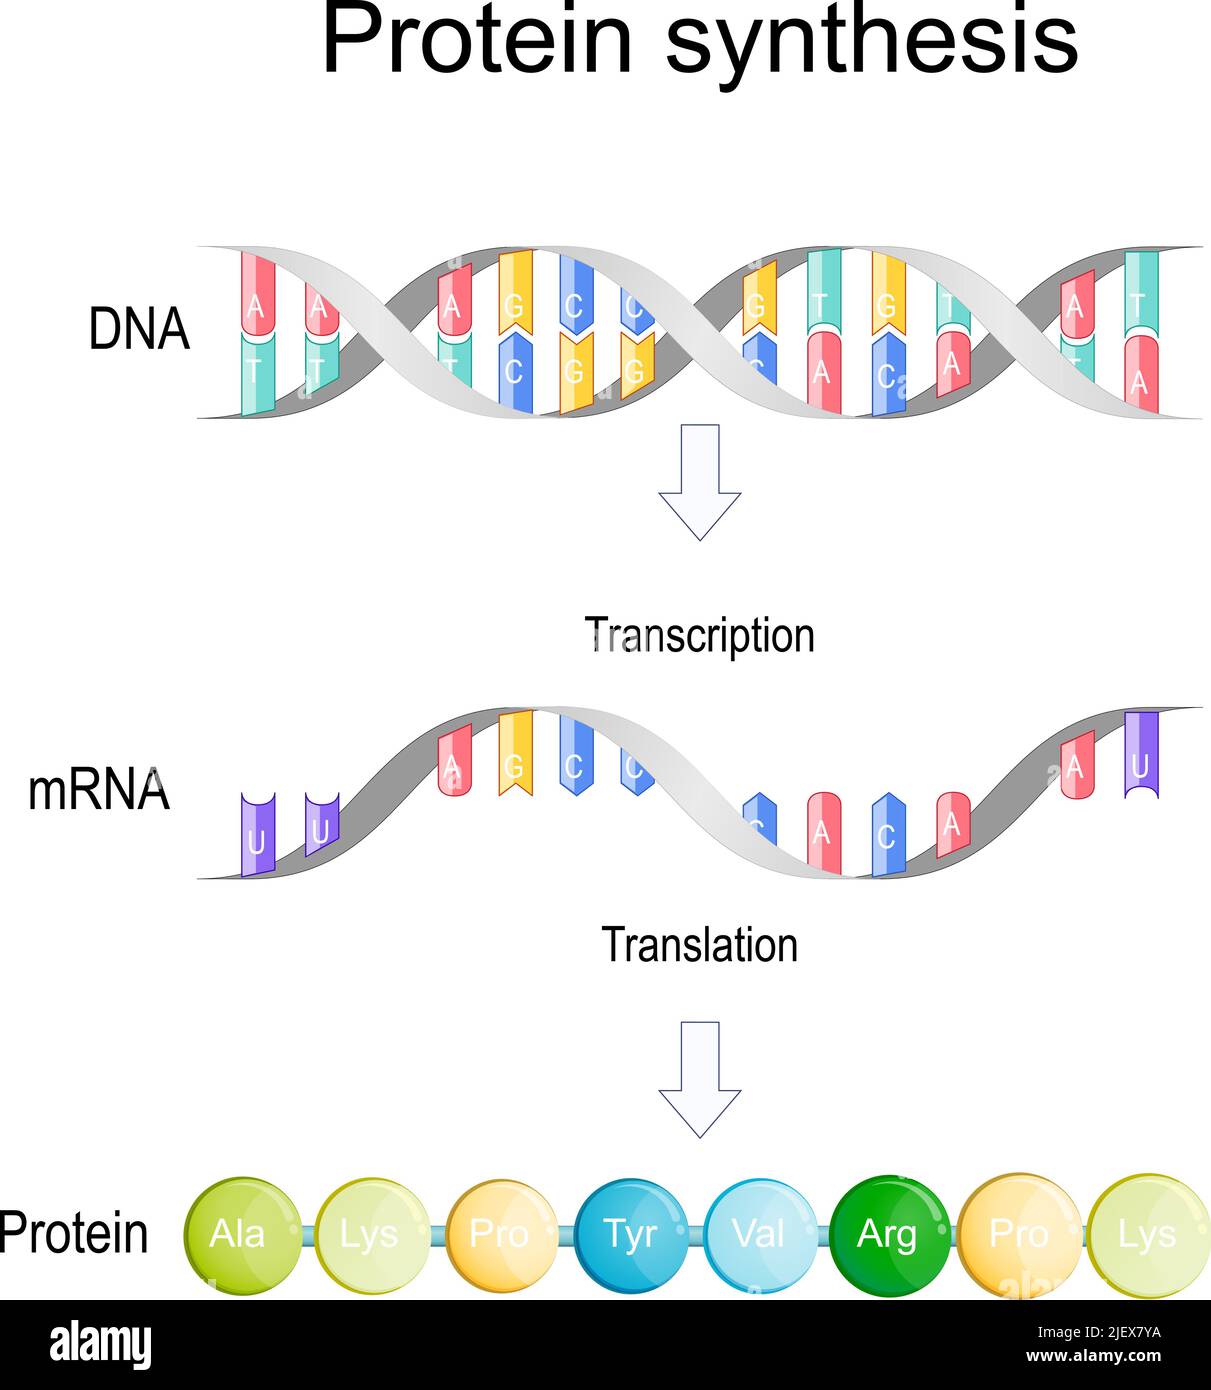
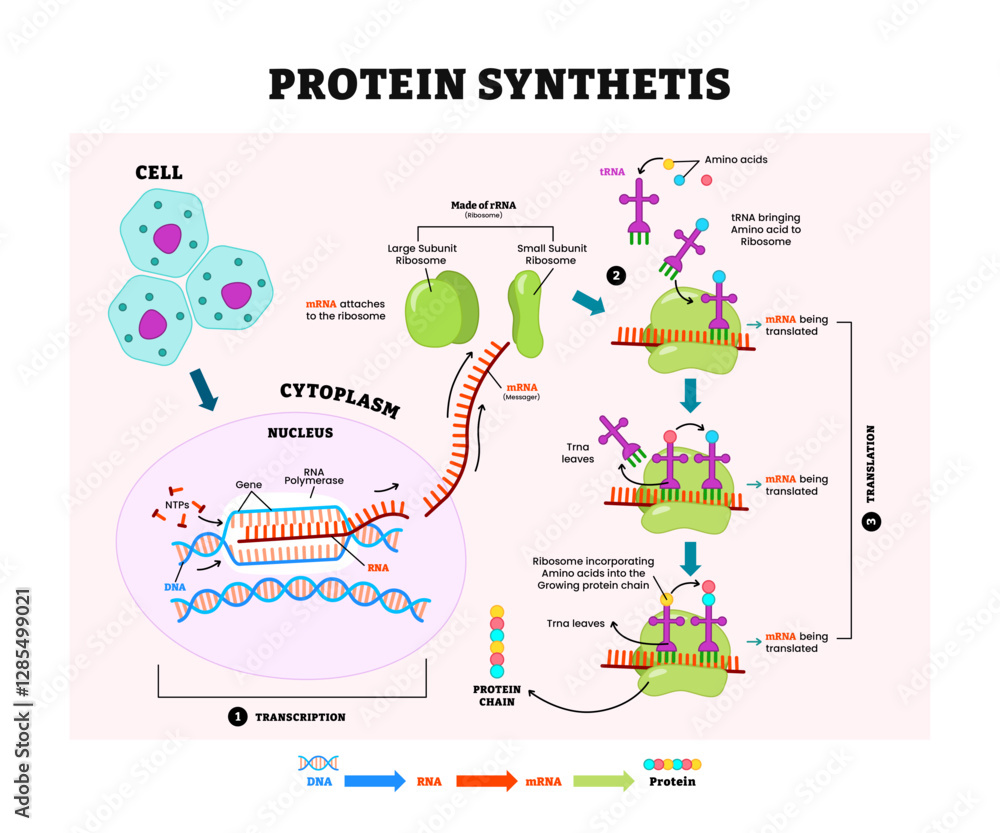
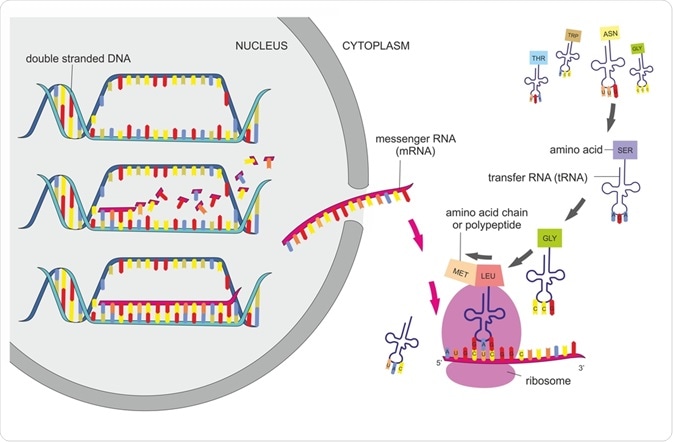
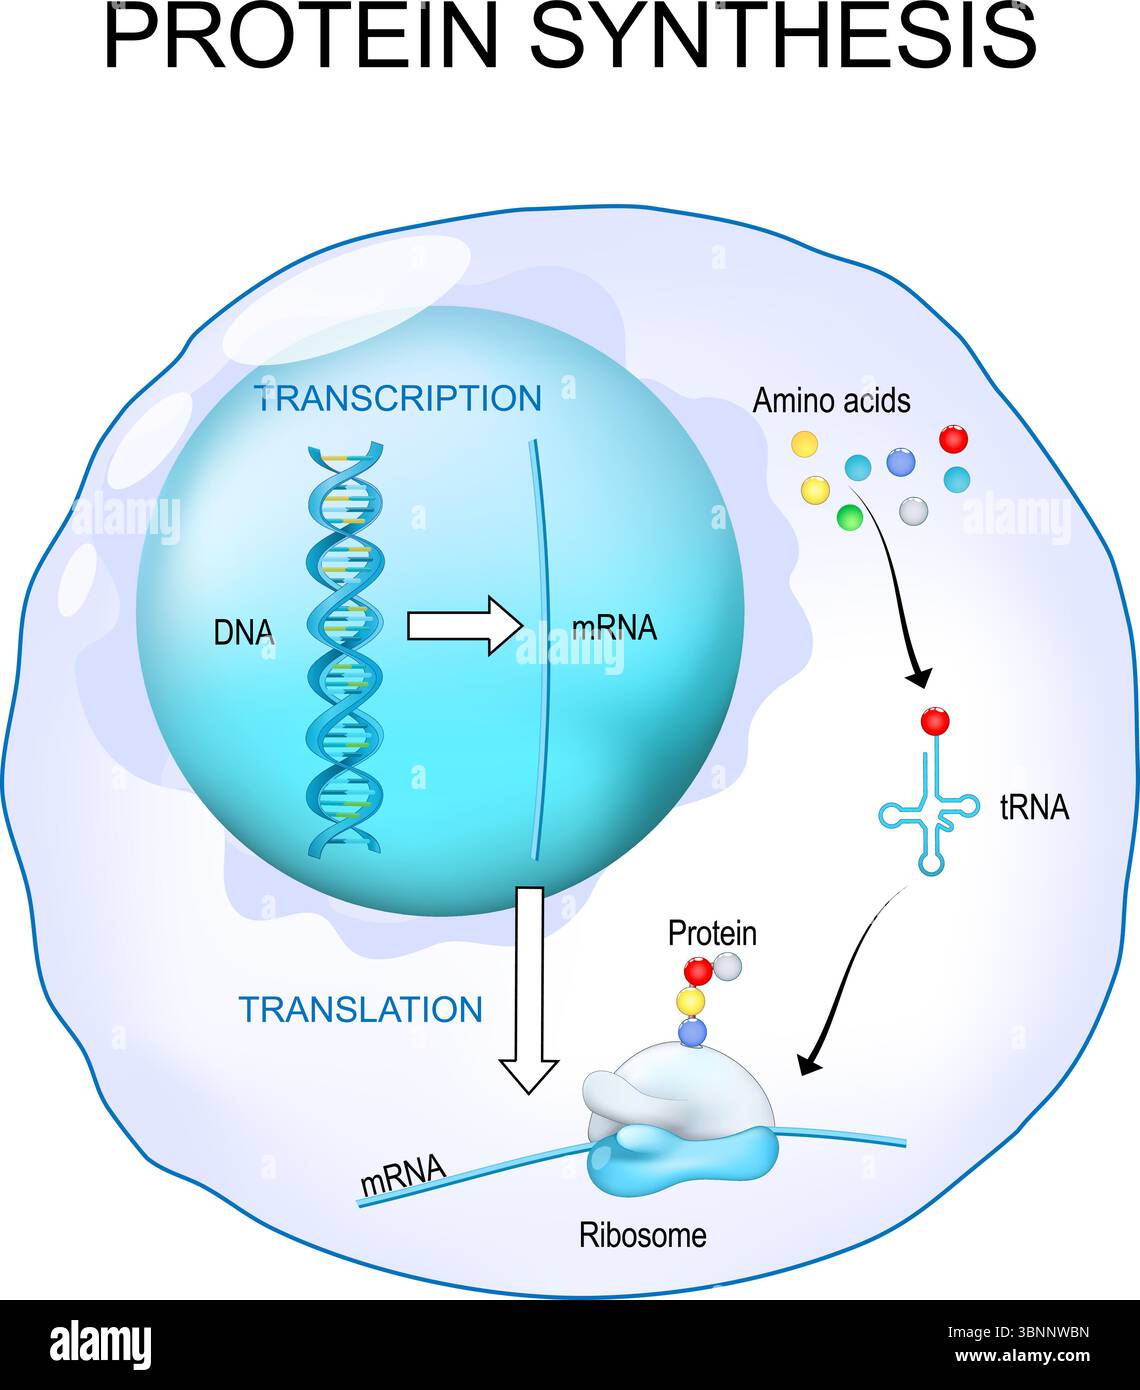
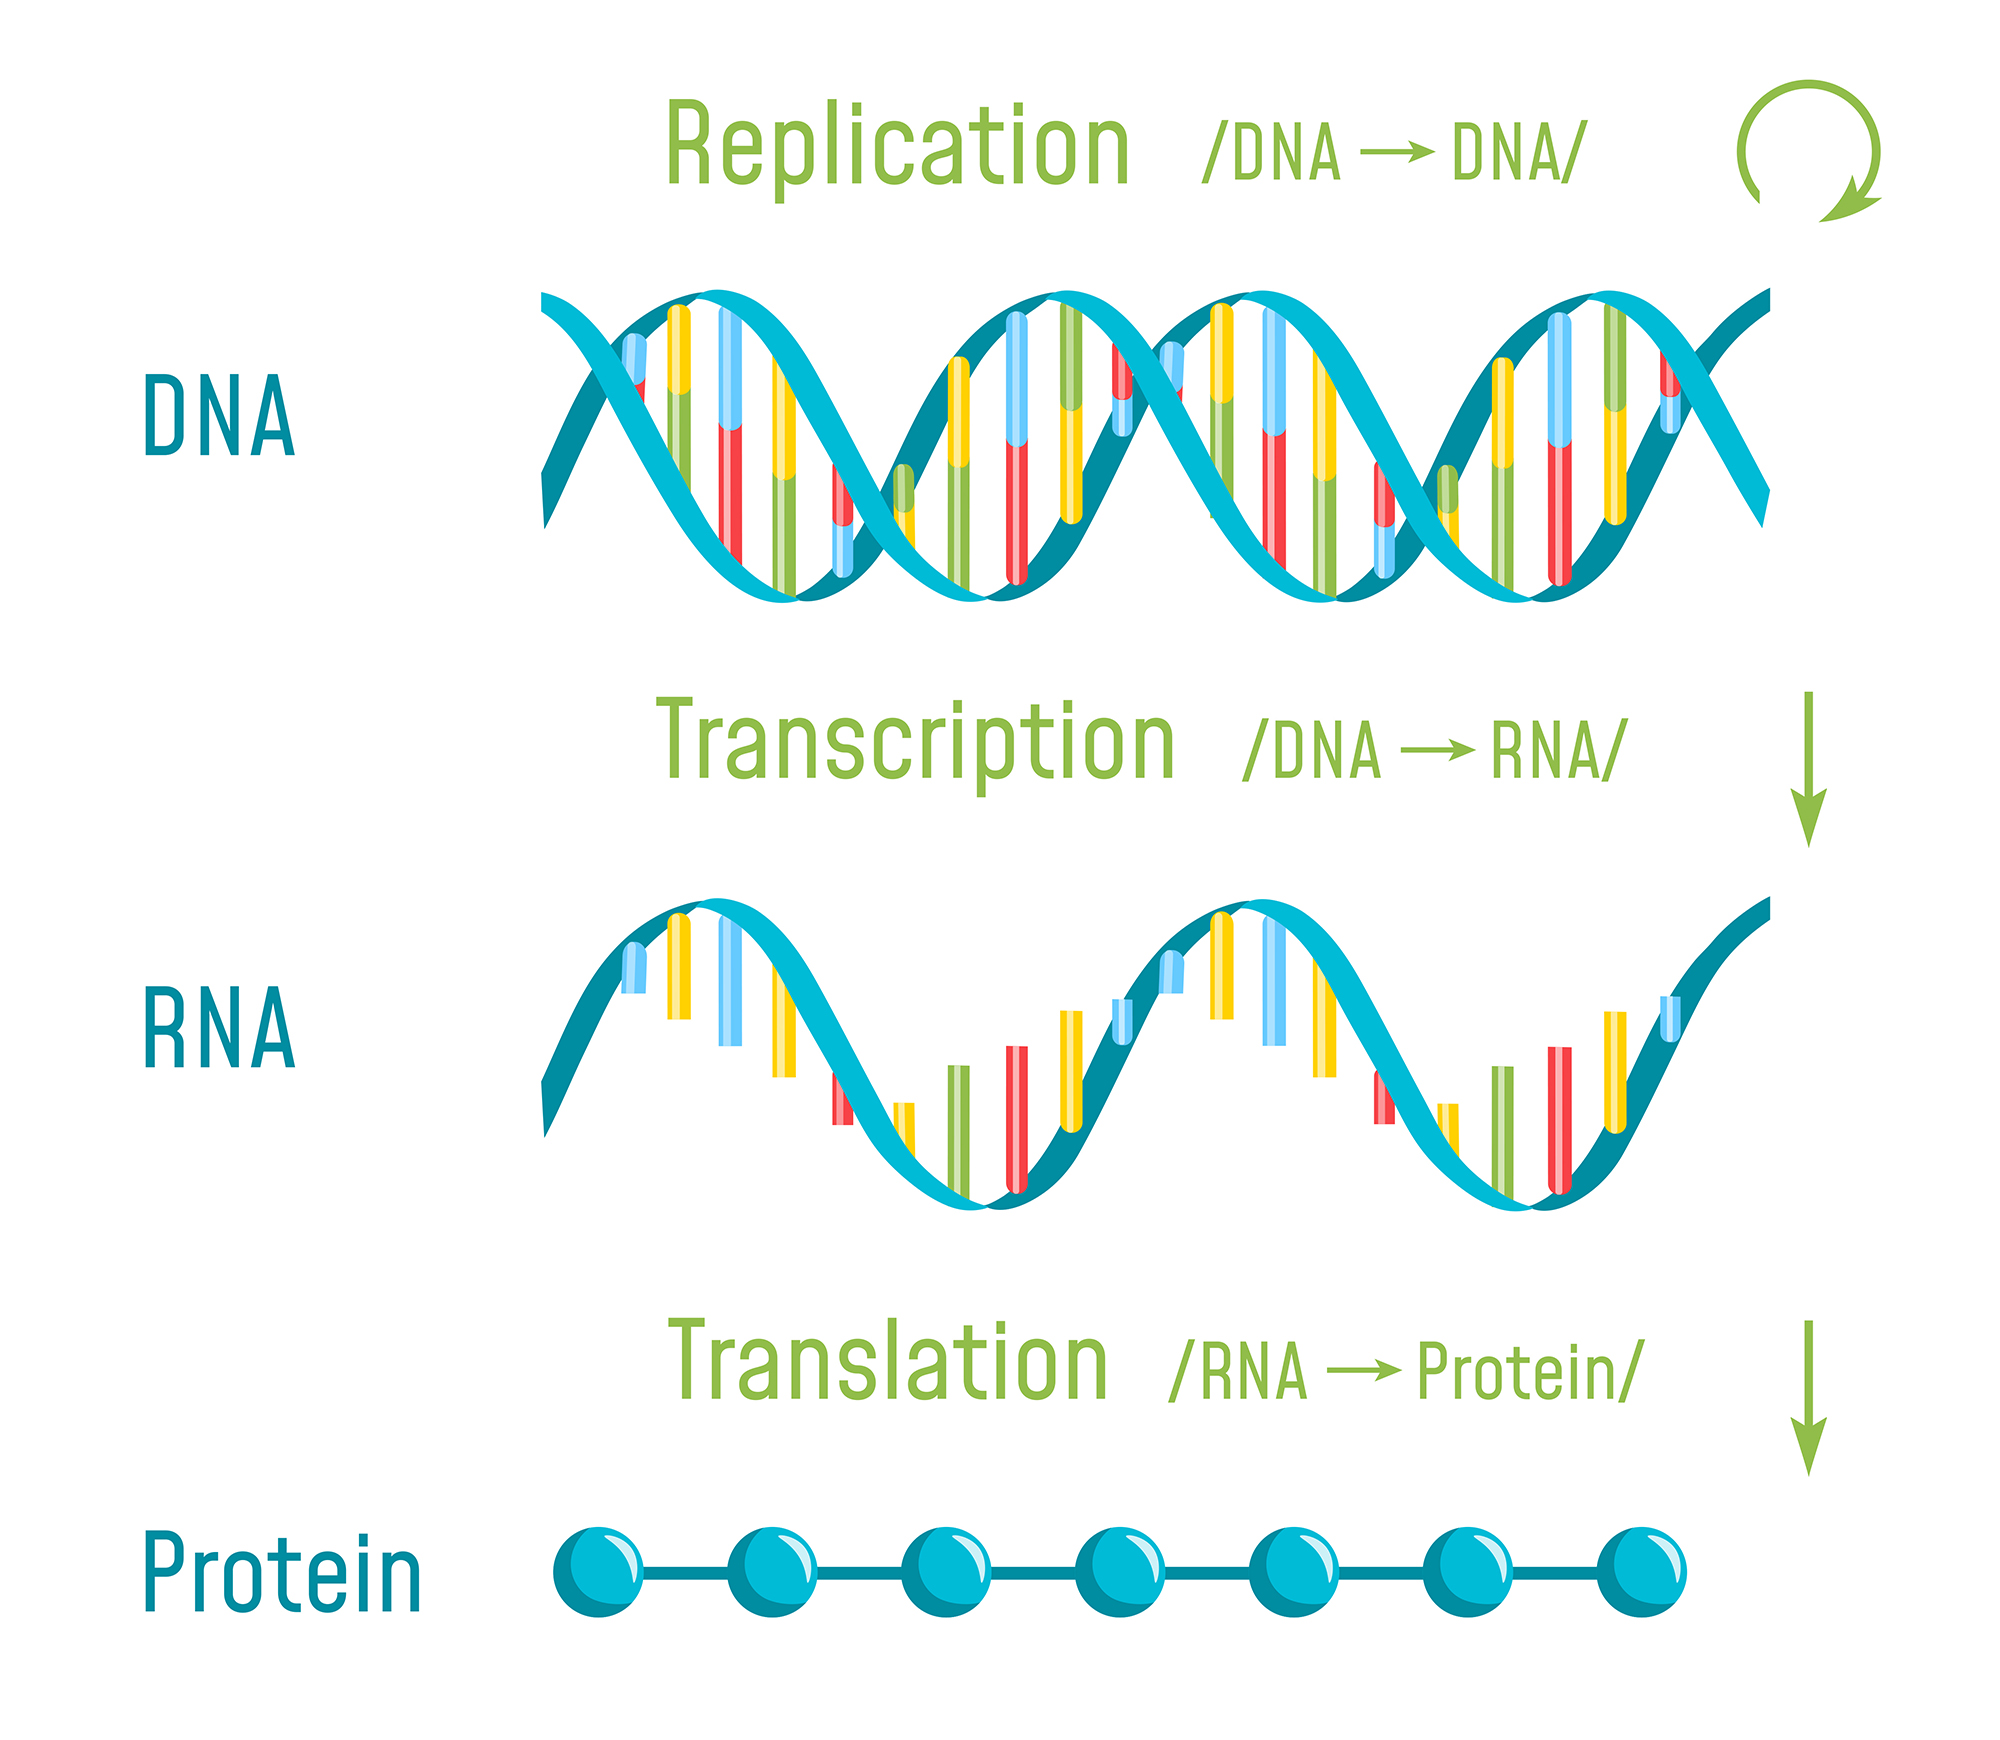
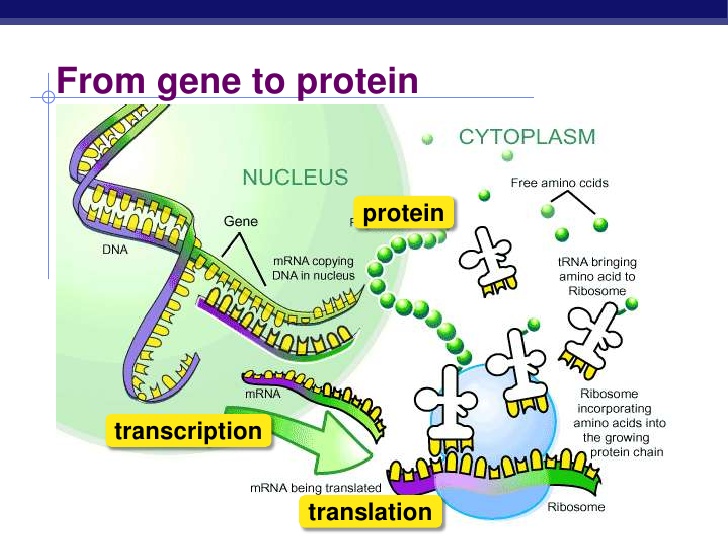
Protein synthesis, also known as gene expression, is the fundamental process by which cells build proteins based on the genetic instructions encoded in DNA. This process is divided into two main stages: transcription, which creates messenger RNA (mRNA) from DNA, and translation, where ribosomes read the mRNA to assemble amino acid chains that fold into functional proteins. Diagrams that depict this pathway help clarify the sequence of events, the key molecules involved, and the spatial organization of the nucleus and cytoplasm.
Transcription: DNA to mRNA
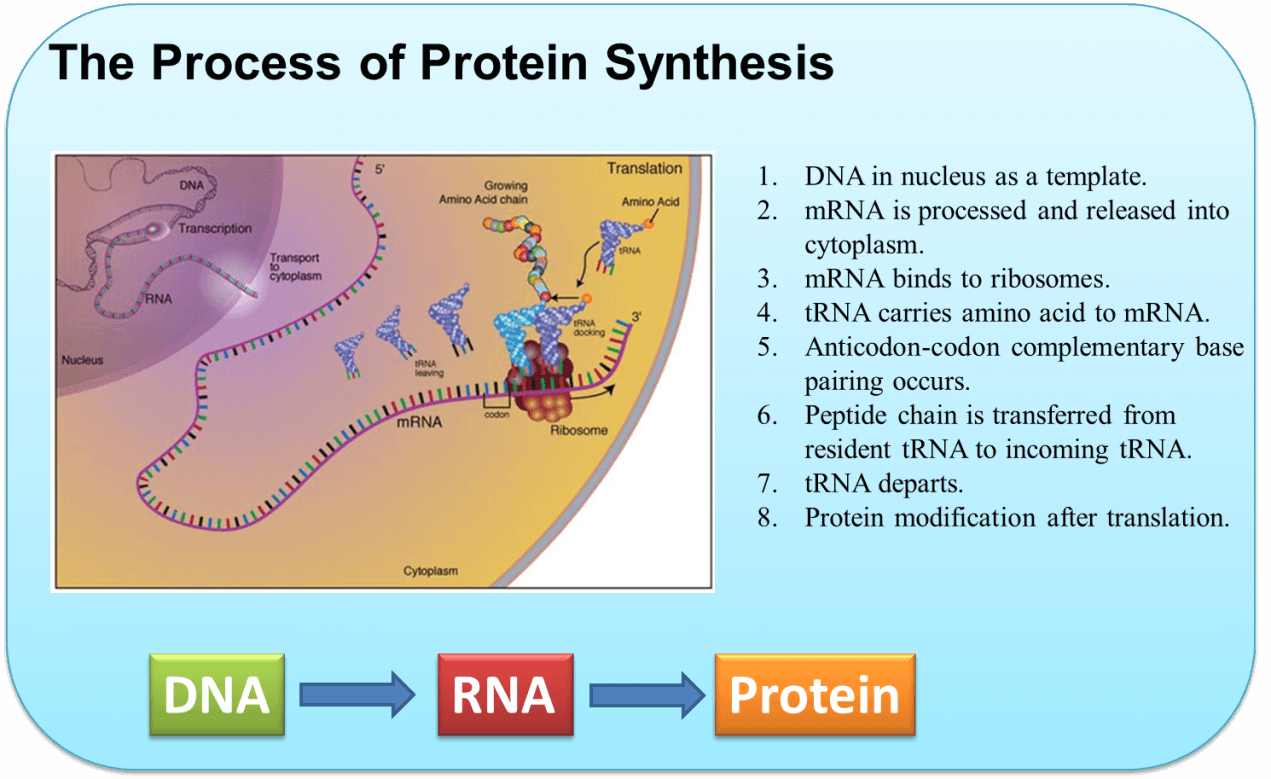
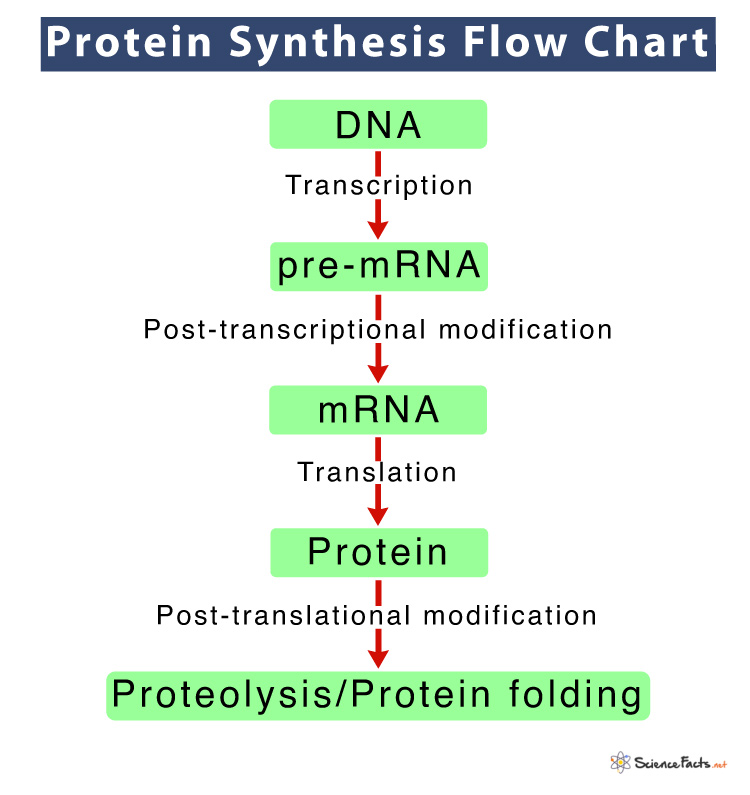
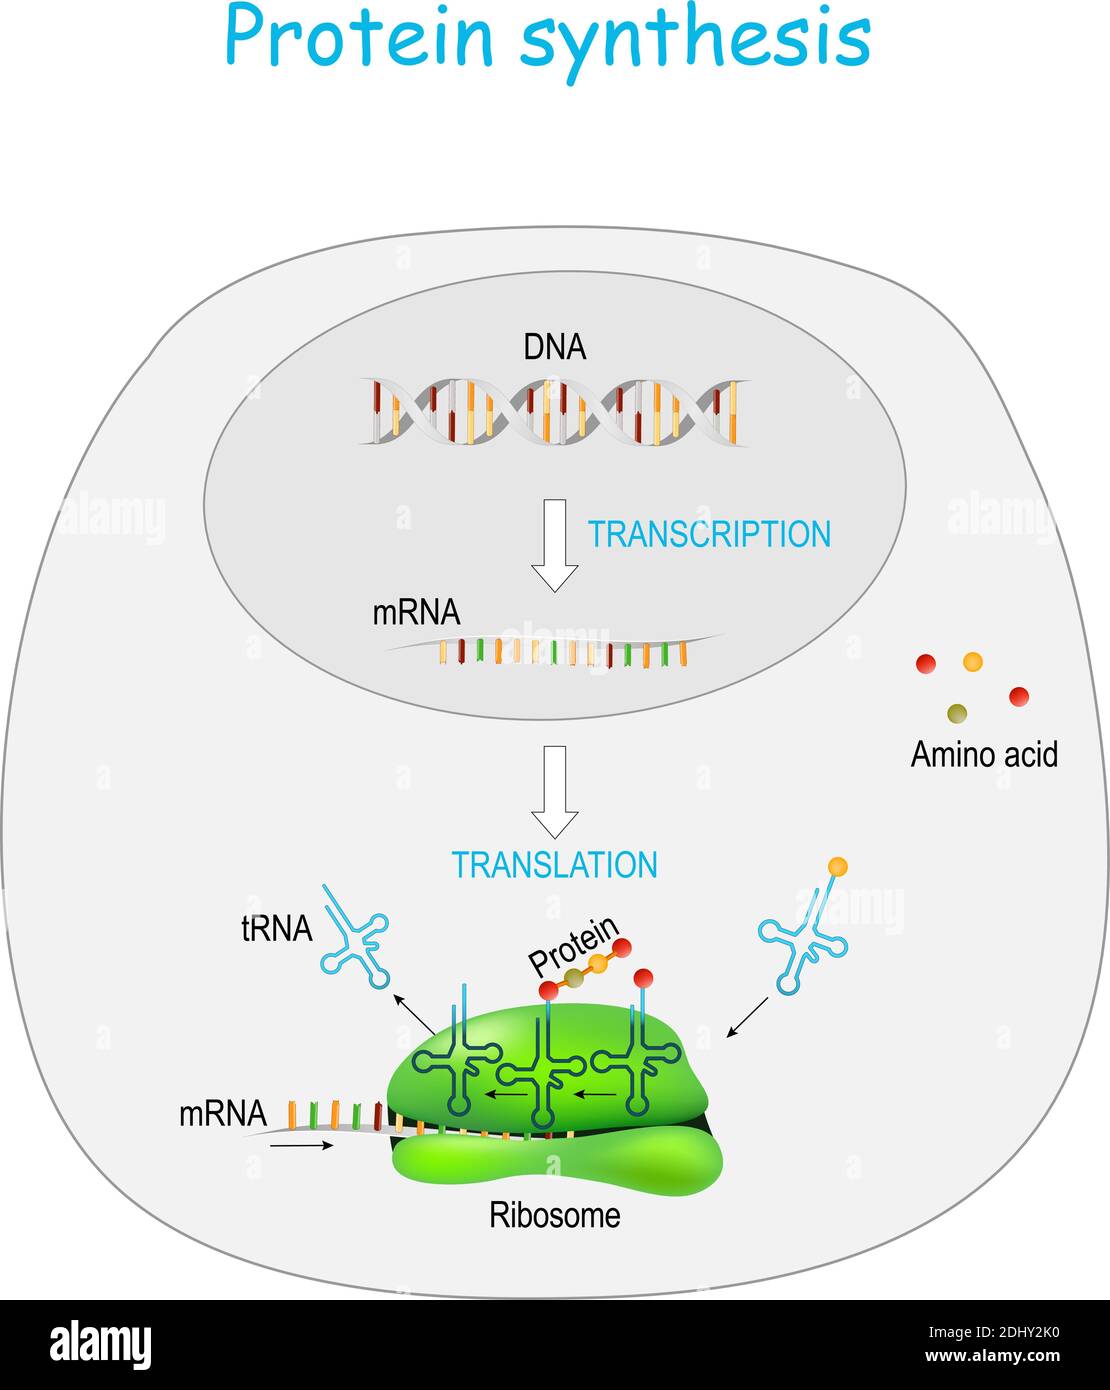
Transcription begins inside the nucleus. RNA polymerase enzymes bind to the promoter region of a gene, separating the DNA strands. The enzyme reads the template strand and synthesizes a complementary RNA sequence. Once the RNA chain reaches the terminator sequence, transcription ends, and the newly formed pre‑mRNA undergoes processing (capping, polyadenylation, and splicing) before exiting the nucleus. Diagrams typically highlight the DNA double helix, the RNA polymerase, and the emerging mRNA strand to emphasize the flow of genetic information.
RNA Processing in Eukaryotes
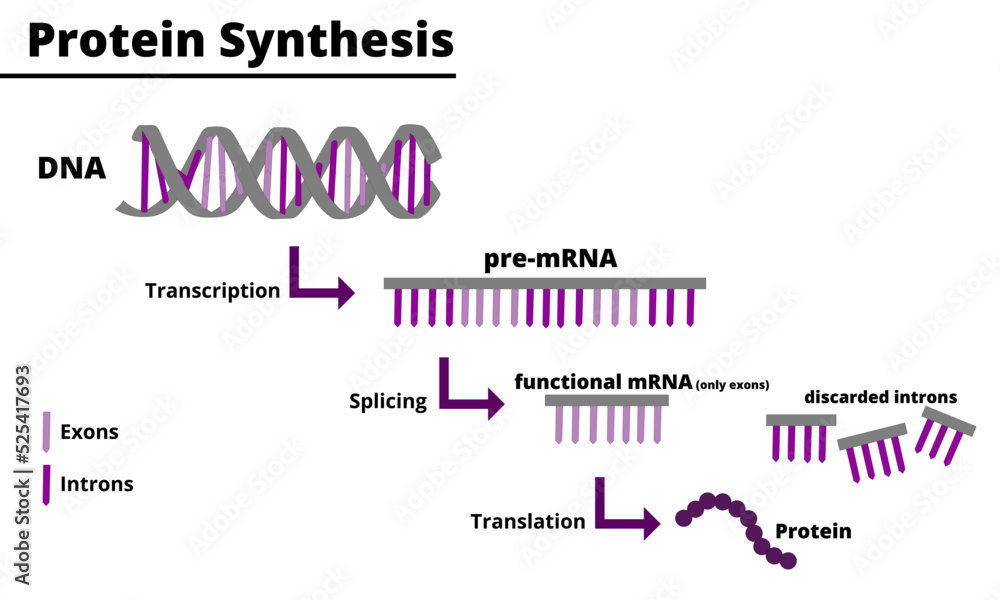
Eukaryotic pre‑mRNA contains both exons and introns. Splicing removes introns, joining exons together into a continuous coding sequence. A 5′ cap and a poly‑A tail are added to protect the mRNA and enhance its export from the nucleus. These modifications are crucial for translation efficiency. Visual representations often show the pre‑mRNA in a single line, with introns depicted as gaps or loops, and the mature mRNA as a streamlined sequence ready for transport.
Translation: mRNA to Protein
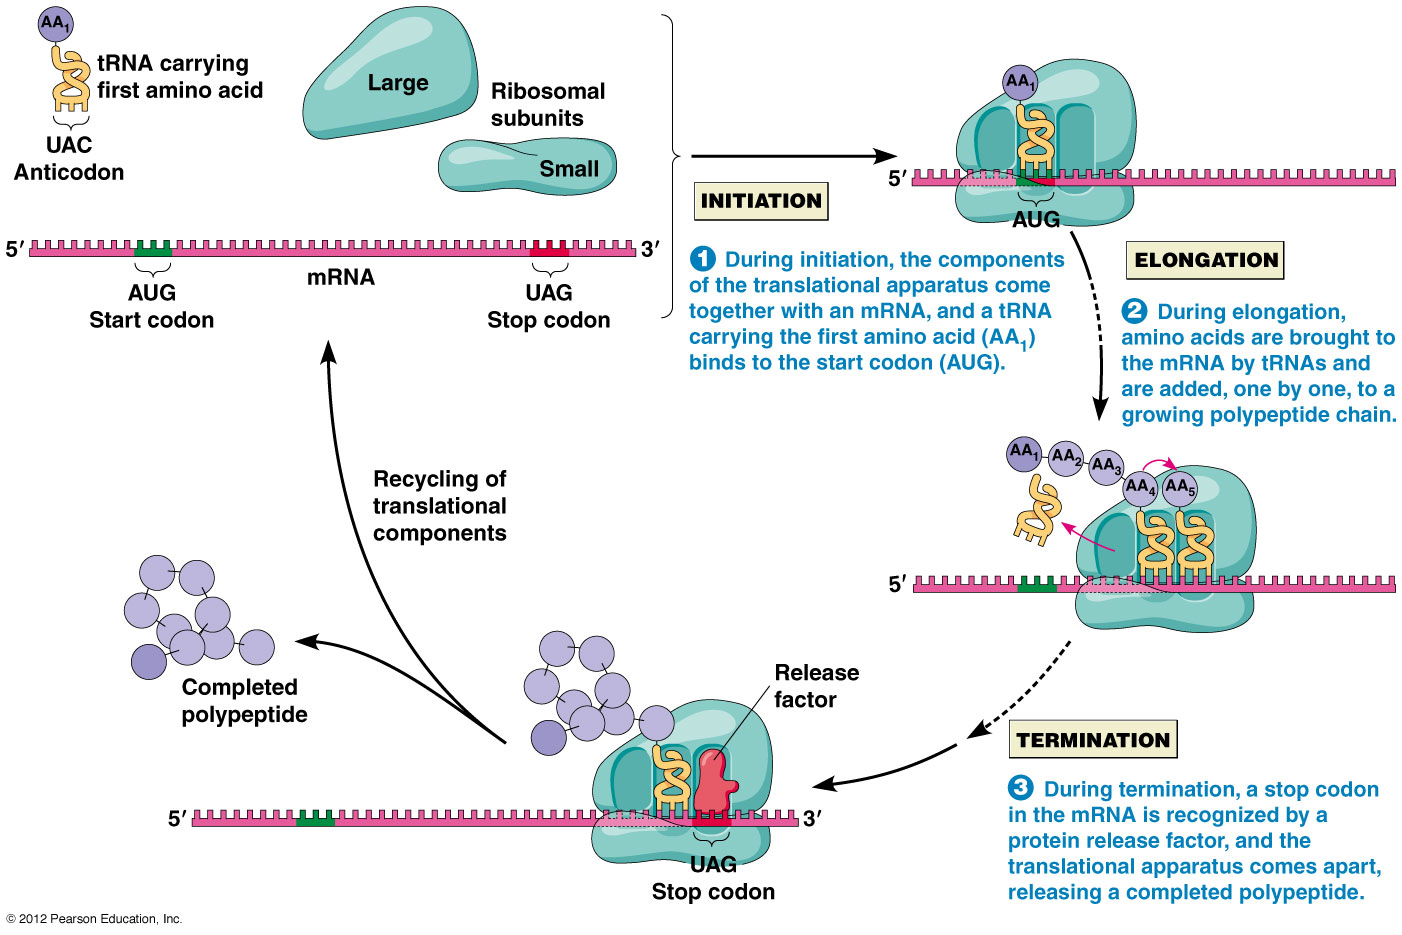
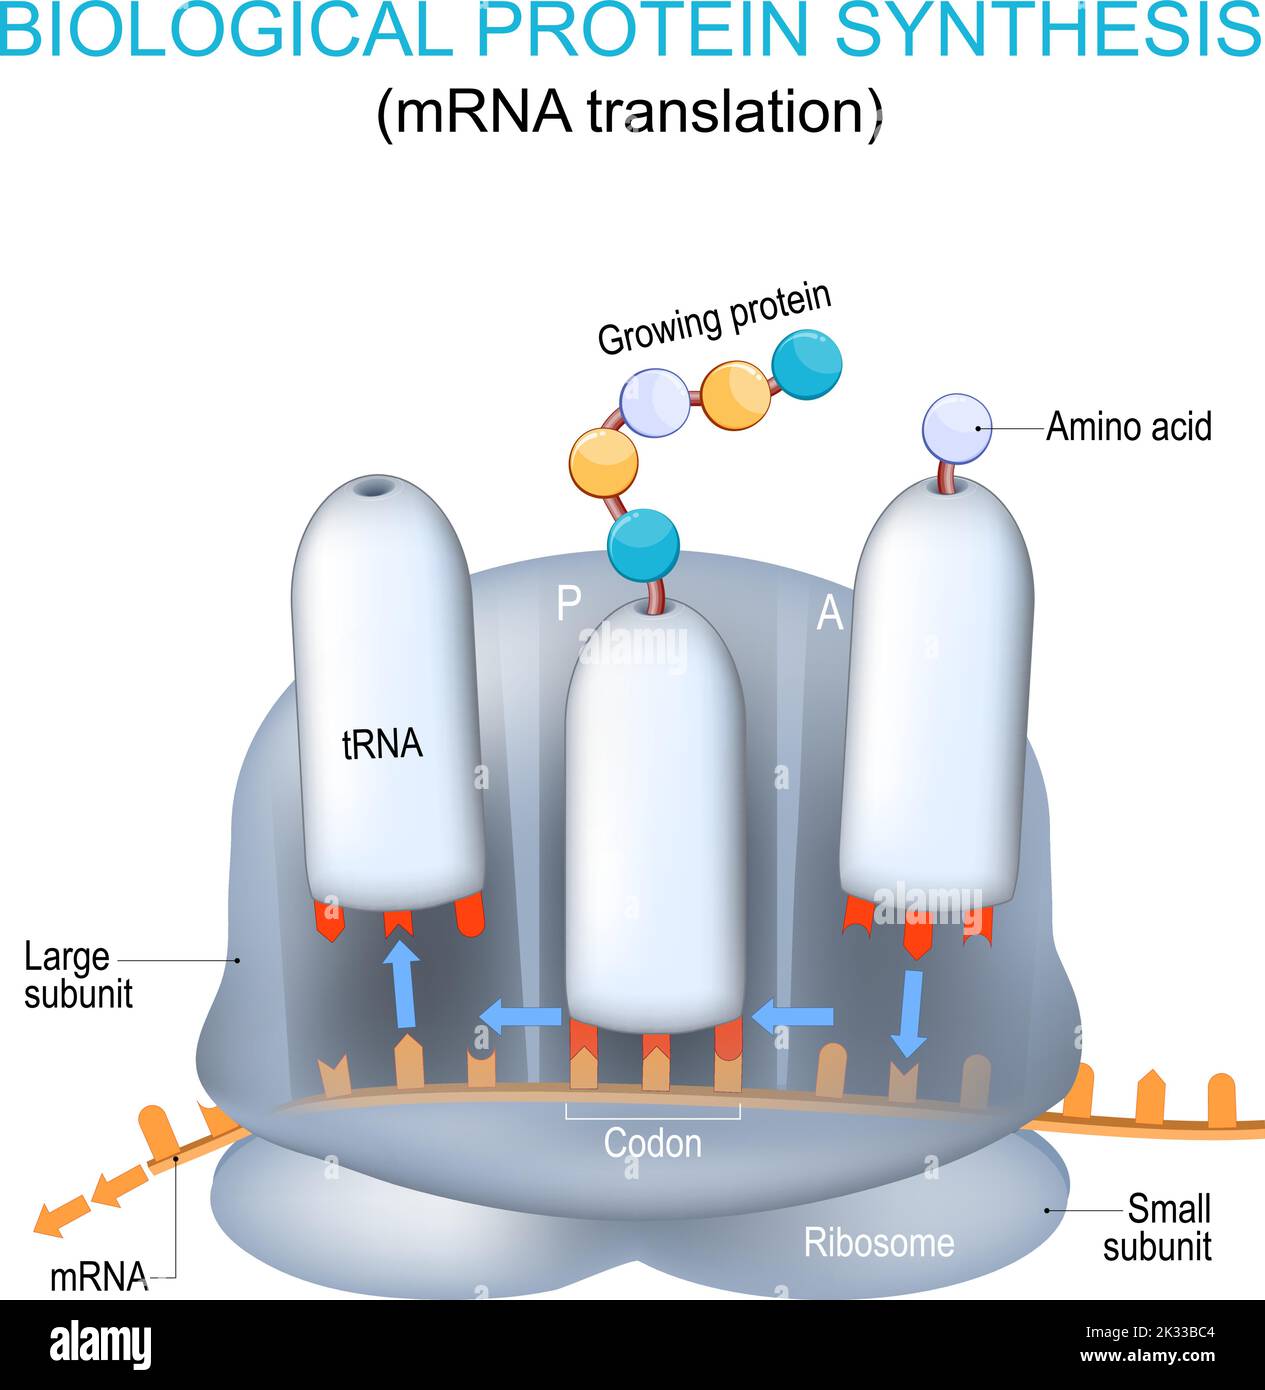
Translation occurs in the cytoplasm on ribosomes. The ribosome reads the mRNA three nucleotides at a time—each codon corresponds to a specific amino acid. Transfer RNA (tRNA) molecules bring the amino acids to the ribosome, matching their anticodons with the mRNA codons. Peptide bonds form between adjacent amino acids, elongating the polypeptide chain until a stop codon signals termination. Diagrams often use color-coded codons, ribosomal subunits, and tRNA molecules to illustrate these interactions.
Ribosome Structure and Function
Ribosomes consist of two subunits: the large (60S) and small (40S) in eukaryotes. The small subunit binds the mRNA and ensures accurate decoding, while the large subunit catalyzes peptide bond formation. The decoding center, peptidyl‑transferase center, and exit tunnel are key functional sites. Illustrations frequently label these components, helping students differentiate between the structural and catalytic roles of each subunit.
Initiation, Elongation, and Termination Phases
Initiation involves the assembly of the ribosomal subunits at the start codon (usually AUG). Elongation follows, with the ribosome moving along the mRNA and adding amino acids. Termination occurs when a stop codon (UAA, UAG, or UGA) is reached; release factors bind, and the finished polypeptide is released. Diagrams typically show arrows indicating the direction of ribosomal movement and markers for the start, stop, and intermediate positions.
Regulation of Protein Synthesis
Cells regulate protein synthesis at multiple levels: transcriptional control, mRNA stability, translational efficiency, and post‑translational modifications. Factors such as transcription factors, miRNAs, and ribosomal proteins can increase or decrease the rate of protein production. Visual guides often include regulatory elements like enhancers, silencers, and miRNA binding sites to illustrate how gene expression is finely tuned.
Common Errors and Quality Control Mechanisms
During translation, frameshift mutations, premature stop codons, and tRNA mischarging can lead to defective proteins. Cells employ quality control systems such as nonsense-mediated decay, the unfolded protein response, and proteasomal degradation to mitigate these errors. Diagrams that showcase faulty ribosome complexes and the associated corrective mechanisms help clarify how fidelity is maintained.
Visualizing Protein Synthesis with Diagrams

The first image provides an overview of the transcription and translation processes. Notice how the DNA double helix gives way to an mRNA strand, which is then translated by a rib
Protein Synthesis Steps Diagram

Protein Synthesis Steps Diagram
Simple Protein Synthesis Diagram Gene Expression With DNA

Simple Protein Synthesis Diagram Gene Expression With DNA
Protein Synthesis Flow Chart Biology – QSJYVG

Protein Synthesis Flow Chart Biology – QSJYVG
Protein Synthesis Diagram Translation (Protein Synthesis) Cell

Protein Synthesis Diagram Translation (Protein Synthesis) Cell
Protein Synthesis Diagram Labeled 1000x1173

Protein Synthesis Diagram Labeled 1000x1173
Protein Synthesis Diagram | Quizlet

Protein Synthesis Diagram | Quizlet
Protein Synthesis Transcription Diagram RNA | Definition, Structure,

Protein Synthesis Transcription Diagram RNA | Definition, Structure,
Protein Synthesis Diagram Simple

Protein Synthesis Diagram Simple
Protein Synthesis Cartoon
Protein Synthesis Cartoon
Protein Synthesis Location Process Steps Diagram Proteinorder

Protein Synthesis Location Process Steps Diagram Proteinorder ...
Protein Synthesis Diagram - Labelled Diagram
Protein Synthesis Diagram - Labelled diagram
Protein Synthesis Diagram Process, Labeled Transcription, Translation
Protein Synthesis Diagram Process, labeled transcription, translation ...
Protein Synthesis Diagram | Quizlet

Protein Synthesis Diagram | Quizlet
Protein Synthesis Steps Diagram

Protein Synthesis Steps Diagram
Protein Synthesis - Notes - Biology | Mrs. McComas

Protein Synthesis - Notes - Biology | Mrs. McComas
Protein Synthesis Steps Diagram
Protein Synthesis Steps Diagram
Protein Synthesis Transcription Diagram

Protein Synthesis Transcription Diagram
Protein Synthesis Labeled Diagram | Anatomy And Structure

Protein synthesis Labeled Diagram | Anatomy and Structure
Protein Synthesis Diagram Labeled 1000x1173
Protein Synthesis Diagram Labeled 1000x1173
Diagram Of Protein Synthesis - GeeksforGeeks

Diagram of Protein Synthesis - GeeksforGeeks
Protein Synthesis Diagram Answer Key At Harry Quintana Blog

Protein Synthesis Diagram Answer Key at Harry Quintana blog
Protein Synthesis In Ribosome. Transcription And Translation Of DNA
Protein synthesis in ribosome. transcription and translation of DNA ...
What Happens During Protein Synthesis – IQLV
What Happens During Protein Synthesis – IQLV
Labeled Diagram Of Protein Synthesis
Labeled Diagram Of Protein Synthesis
Protein Synthesis Transcription Diagram – VJNT
Protein Synthesis Transcription Diagram – VJNT
Protein Synthesis Review Worksheet - Admuscente
Protein Synthesis Review Worksheet - Admuscente
Protein Synthesis

Protein Synthesis
Amino Acid Ribosome Protein Synthesis At Patrick Lakes Blog
Amino Acid Ribosome Protein Synthesis at Patrick Lakes blog
Protein Synthesis Steps Diagram
Protein Synthesis Steps Diagram
Sites Of Protein Synthesis : Protein Structure And Synthesis: Video
Sites Of Protein Synthesis : Protein structure and synthesis: Video ...
Protein Synthesis: Translation Diagram | Quizlet

Protein Synthesis: Translation Diagram | Quizlet
Protein Synthesis Practice Worksheet - Admuscente

Protein Synthesis Practice Worksheet - Admuscente
1,582 Protein Synthesis Diagram Royalty-Free Images, Stock Photos

1,582 Protein Synthesis Diagram Royalty-Free Images, Stock Photos ...
Protein Synthesis Name Of Process At Donald Frame Blog

Protein Synthesis Name Of Process at Donald Frame blog
Protein Synthesis Transcription Diagram

Protein Synthesis Transcription Diagram