Understanding the Diagram of Phase Changes of Matter: A Comprehensive Guide
In this guide, you will discover the intricate relationships between solid, liquid, and gas phases, learn how to interpret a phase diagram, and see real-world applications that rely on these principles. By the end, you'll have a clear mental map of how temperature and pressure dictate the state of matter and the transitions that occur between them.
Overview of States of Matter
Matter traditionally exists in three primary states—solid, liquid, and gas—each characterized by distinct particle arrangements and motion. Solids have particles locked in a rigid lattice, liquids flow with particles closely packed yet free to move, and gases exhibit high kinetic energy, allowing particles to disperse widely. Beyond these, plasma and Bose–Einstein condensates occupy special categories under extreme conditions, yet the core focus remains on the three common phases that dominate everyday life.
The Phase Diagram Explained
A phase diagram visually maps the equilibrium conditions between the solid, liquid, and gaseous phases of a substance. On the diagram, the x-axis usually represents temperature while the y-axis represents pressure. The curves that separate the phases are called phase boundaries. When a substance's state lies above the liquid–gas boundary, it is in the gas phase; below the solid–liquid boundary, it is solid; and between the two curves, the substance is liquid. The intersection of all three boundaries is called the triple point, where solid, liquid, and gas coexist in equilibrium.
Understanding this diagram allows scientists and engineers to predict how a material behaves under varying environmental conditions, design processes for heating or cooling, and control manufacturing conditions for pharmaceuticals, metallurgy, and more.
Key Points in the Diagram
Below the phase diagram, certain critical features deserve special attention:
- Melting and Freezing Lines: These curves illustrate the temperatures at which a substance transitions from solid to liquid and vice versa under varying pressures.
- Boiling and Condensation Lines: These lines define the temperatures at which a liquid turns into a gas and the reverse.
- Critical Point: At this point, the distinction between liquid and gas disappears; beyond it, the substance exists as a supercritical fluid.
- Triple Point: The unique combination of temperature and pressure where all three phases coexist. For water, this occurs at 0.01°C and 0.006 atm.
- Clapeyron Equation: A mathematical relation that describes the slope of the phase boundary, linking changes in pressure to changes in temperature.
These elements combine to provide a comprehensive framework for predicting phase behavior in both natural and engineered systems.
Practical Applications and Real-World Examples
Phase diagrams are indispensable tools across many industries:
- Aviation: The behavior of jet fuel under extreme temperatures and pressures ensures safe operations. Engineers consult fuel phase diagrams to prevent vapor lock.
- Food Preservation: Freezing and thawing cycles rely on precise knowledge of water's phase transitions to maintain texture and safety.
- Metallurgy: Alloys are engineered by understanding how metallic elements transform under heat treatment, directly referencing phase diagrams for composition‑temperature relationships.
- Pharmaceuticals: Drug stability during storage is assessed via phase behavior, preventing unwanted crystallization that could affect efficacy.
- Climate Science: The water cycle hinges on evaporation, condensation, and precipitation, all governed by the phase diagram of water.
By integrating phase diagram data, professionals can optimize processes, enhance safety, and improve product quality.
Common Misconceptions
Several misunderstandings frequently arise when interpreting phase diagrams:
- “Higher pressure always raises boiling point.” While true for many substances, some materials exhibit retrograde behavior where increasing pressure lowers the boiling temperature.
- “The diagram shows only the stable phase.” Many diagrams illustrate equilibrium boundaries, but kinetic factors can trap a substance in a metastable state.
- “Temperature alone determines phase.” Pressure is equally critical; the same temperature can result in different phases under varying pressures.
- “Phase transitions happen instantly.” Real transitions involve finite timescales, nucleation, and growth rates, especially important in industrial settings.
Clarifying these points ensures accurate application of phase diagram data in practice.
Conclusion
Mastering the diagram of phase changes empowers scientists, engineers, and technicians to predict how substances behave across a spectrum of conditions. By understanding the interplay of temperature, pressure, and the distinct phases of matter, one can design better processes, troubleshoot complex systems, and appreciate the fundamental physics governing everyday materials. Whether you are analyzing a new alloy, optimizing a refrigeration cycle, or simply exploring the mysteries of water, the phase diagram remains a cornerstone reference that bridges theory and application.
Vettoriale Stock Vector Diagram With Changing States Of Matter, Three
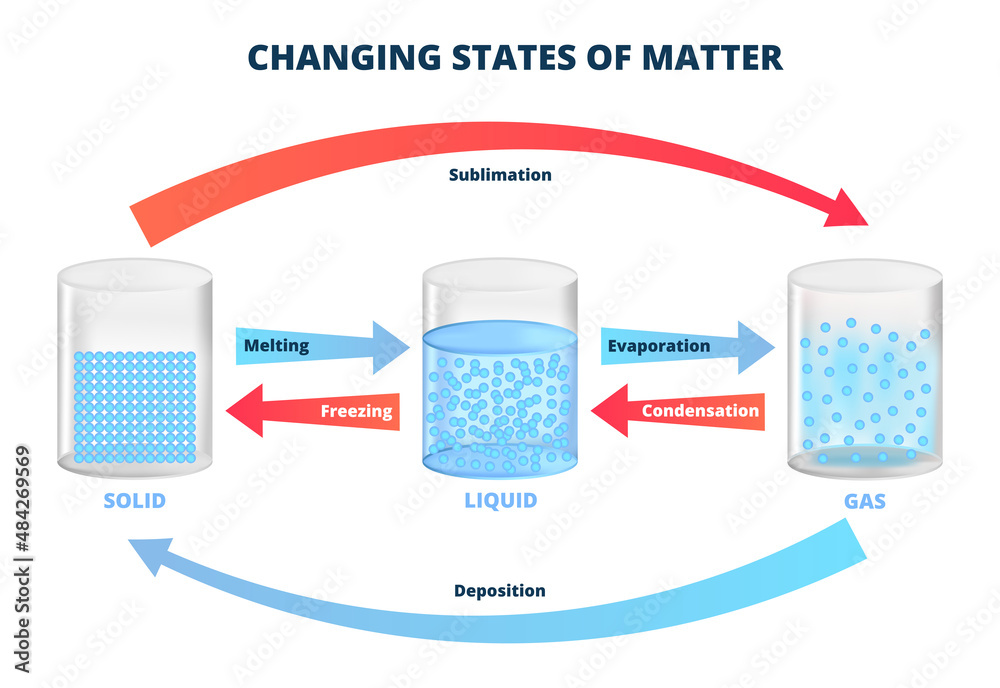
Vettoriale Stock Vector diagram with changing states of matter, three ...
Diagram Showing The Changing States Of Matter Download PPT States Of

Diagram Showing The Changing States Of Matter Download PPT States Of
Changing States Of Matter Diagram

Changing States Of Matter Diagram
Phase Changes To Gas, Liquid And Solid States Of Matter Outline Diagram

Phase Changes To Gas, Liquid and Solid States of Matter Outline Diagram ...
Diagram Showing The Changing States Of Matter Download
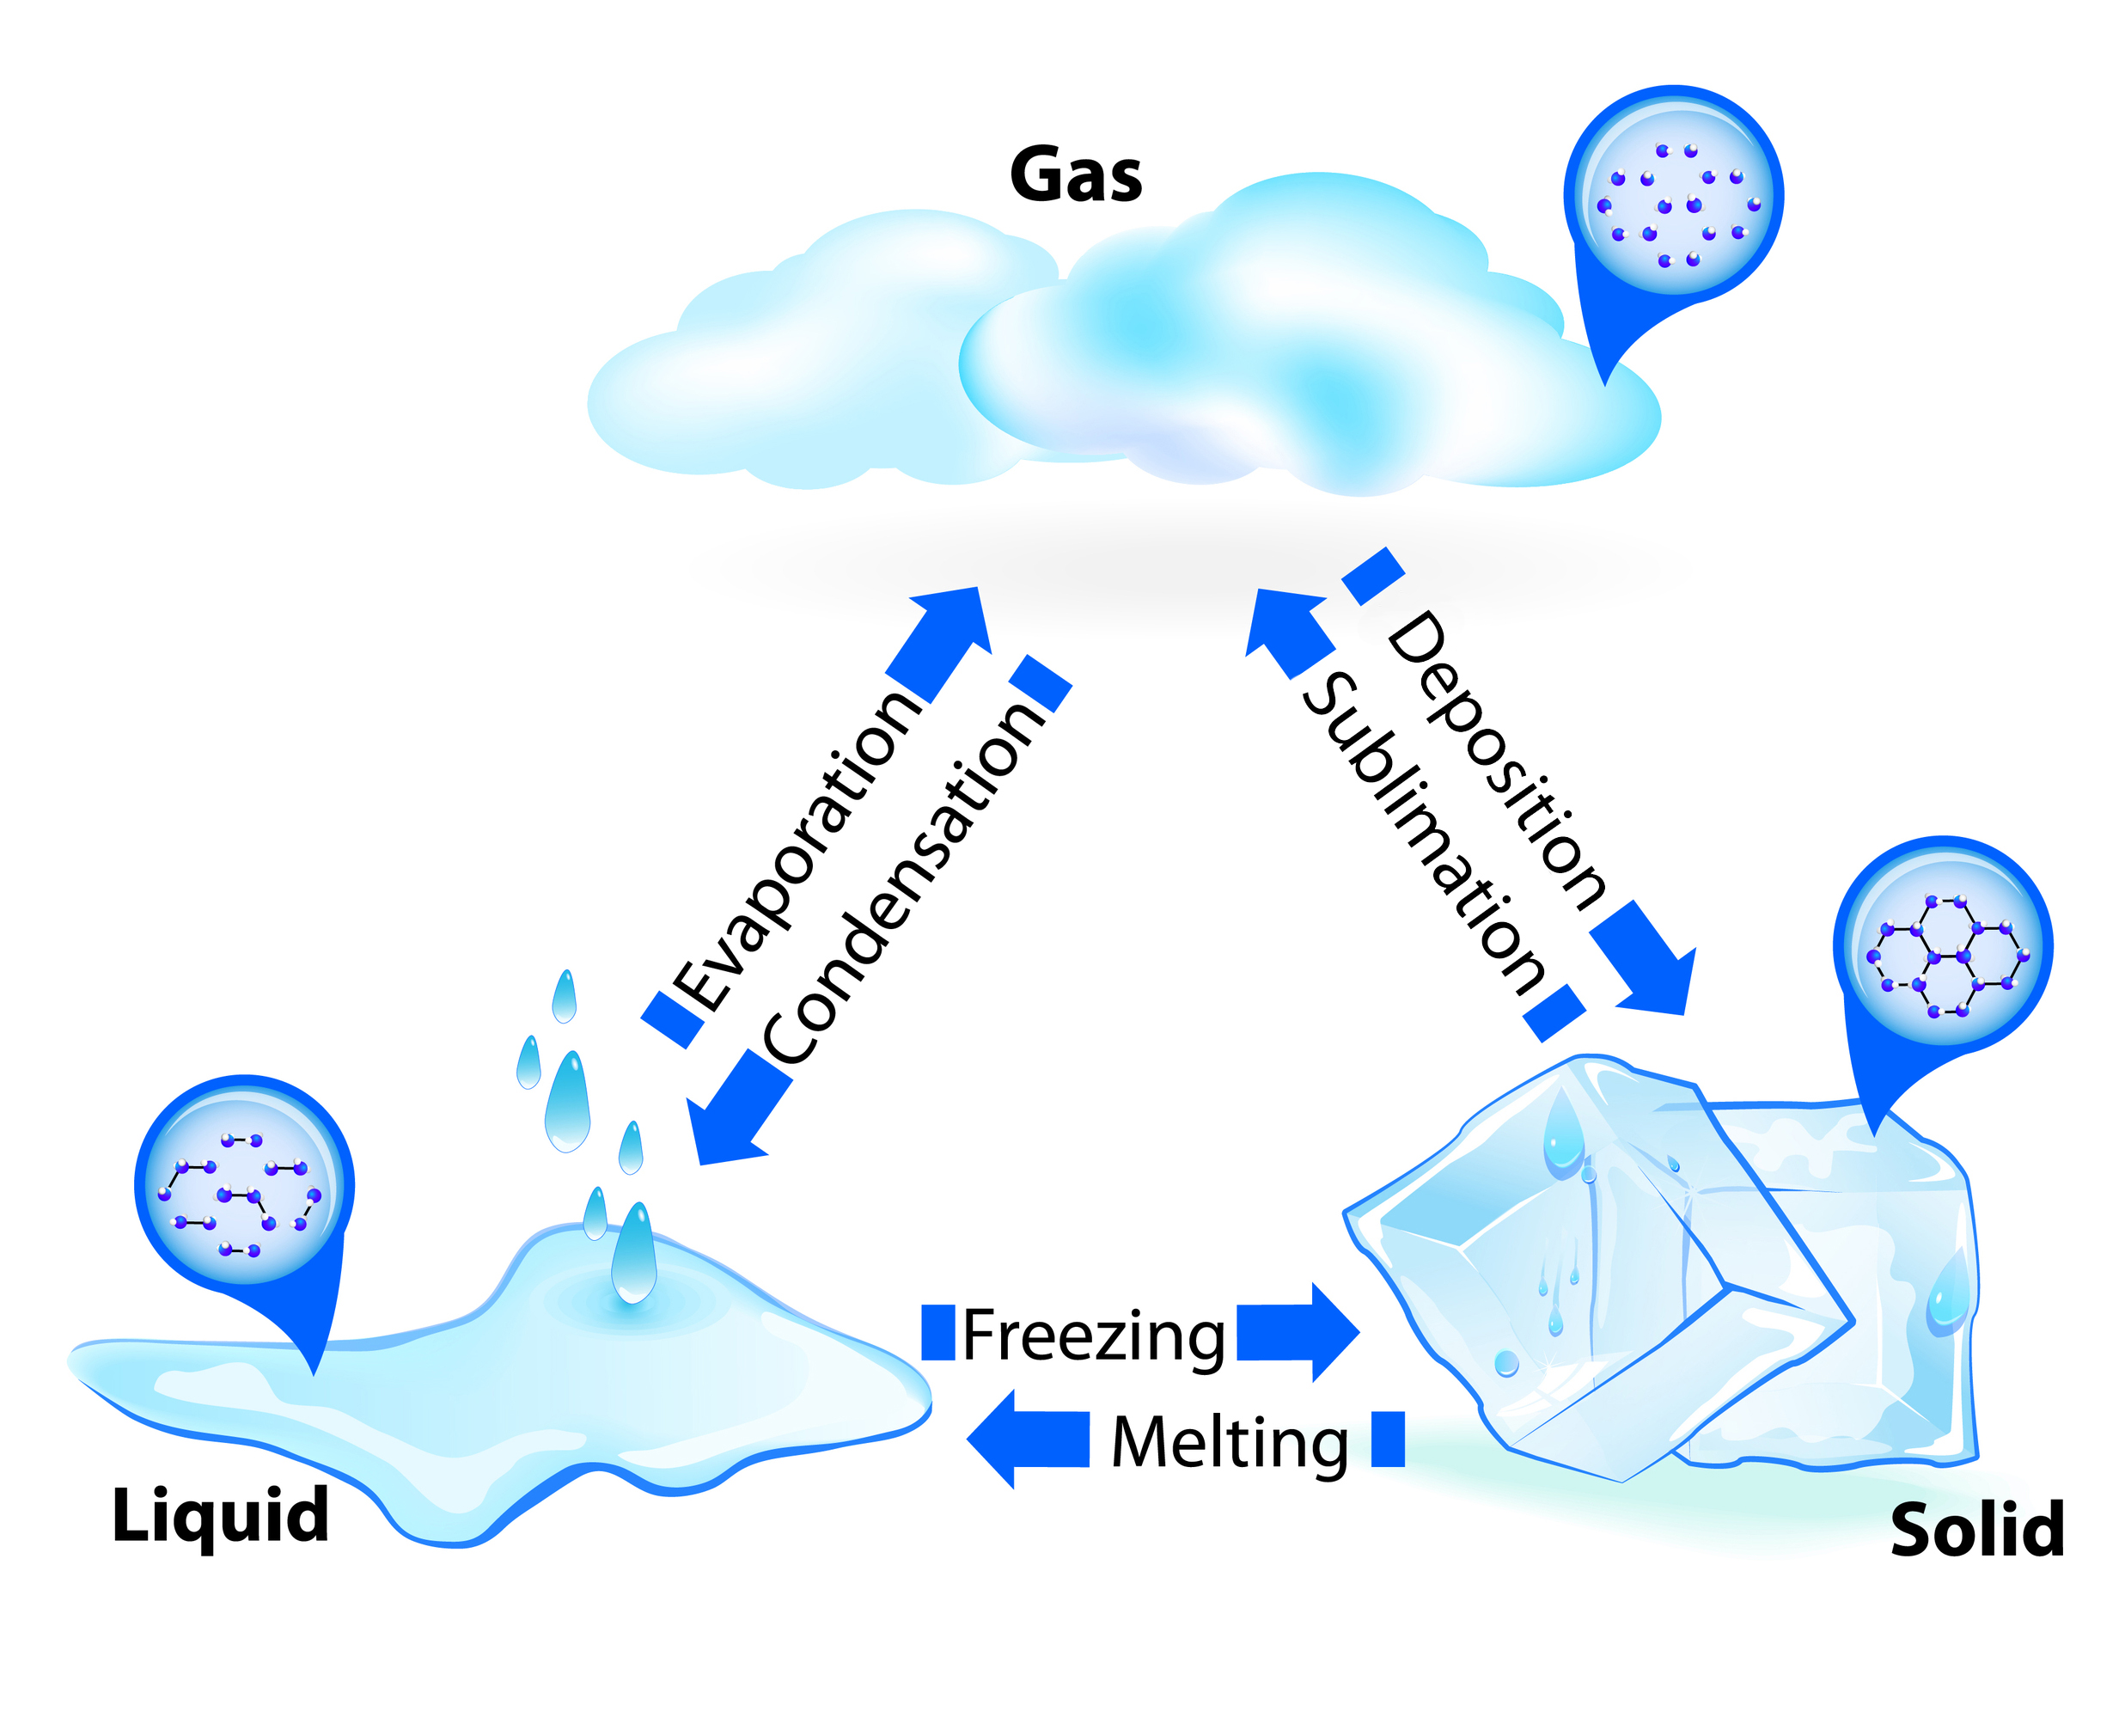
Diagram Showing The Changing States Of Matter Download
Changing States Of Matter Diagram
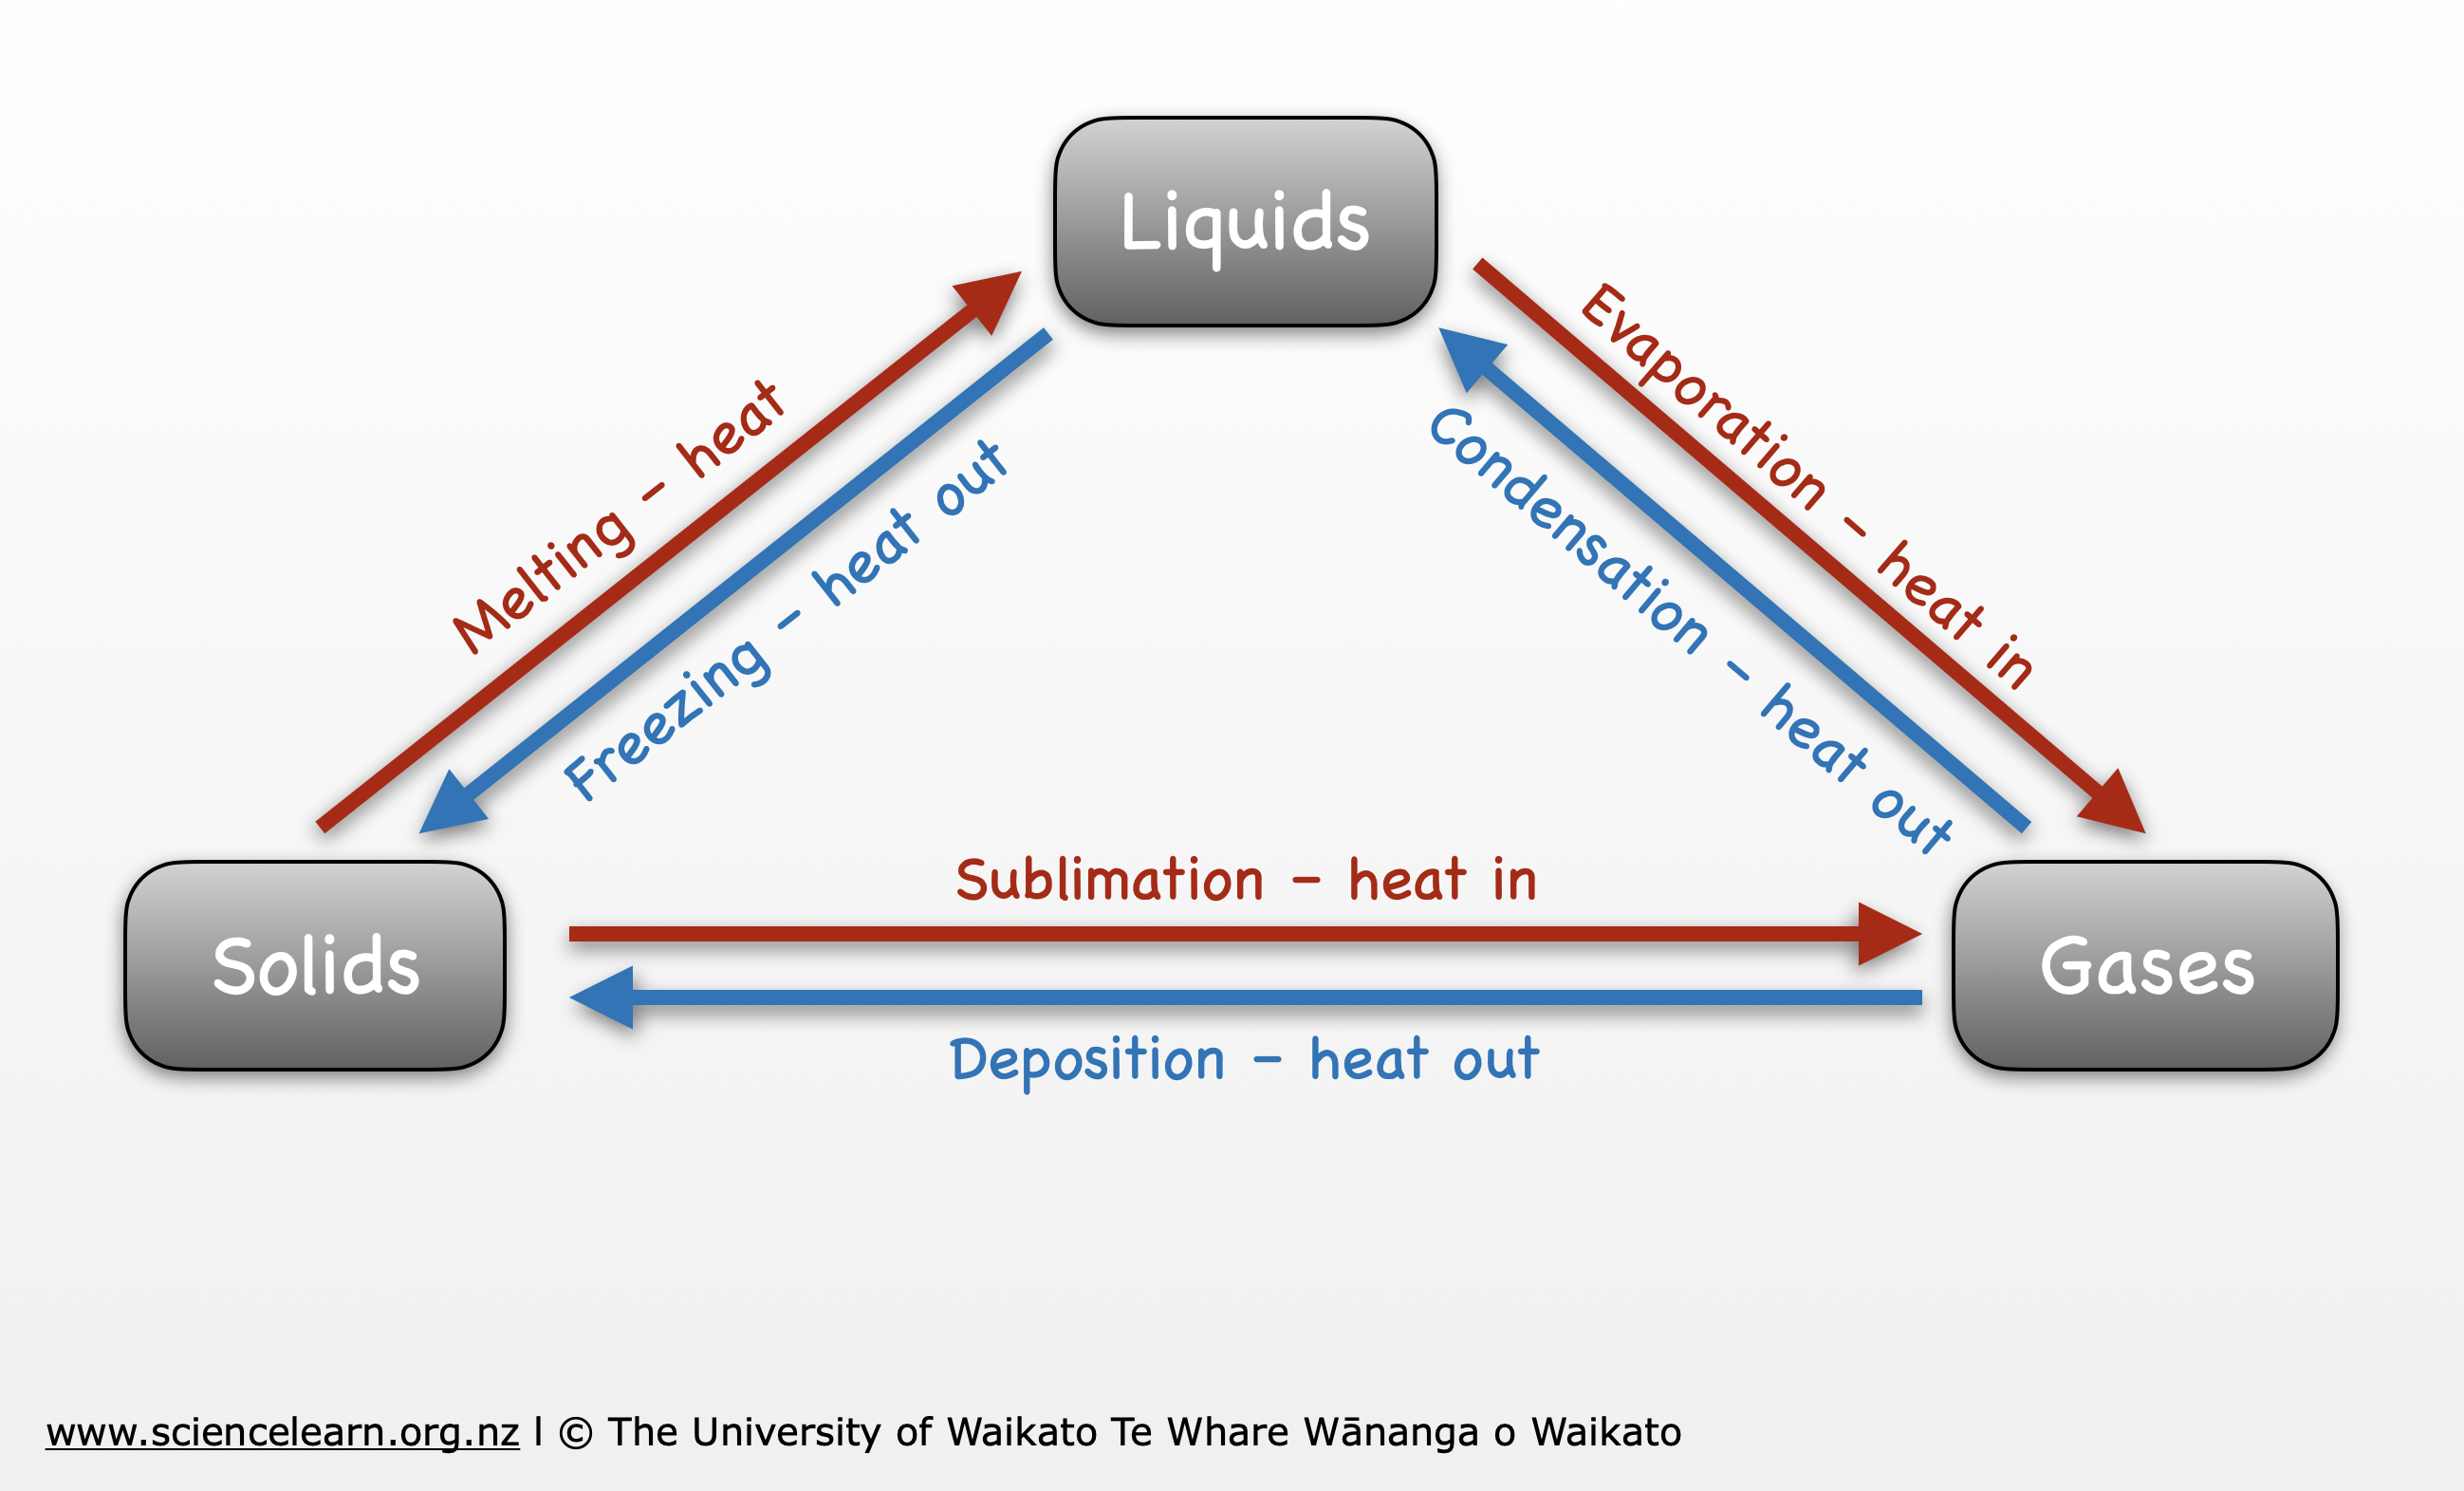
Changing States Of Matter Diagram
Changes Of State | GCSE Chemistry Revision

Changes of State | GCSE Chemistry Revision
Explainer: What Are The Different States Of Matter?
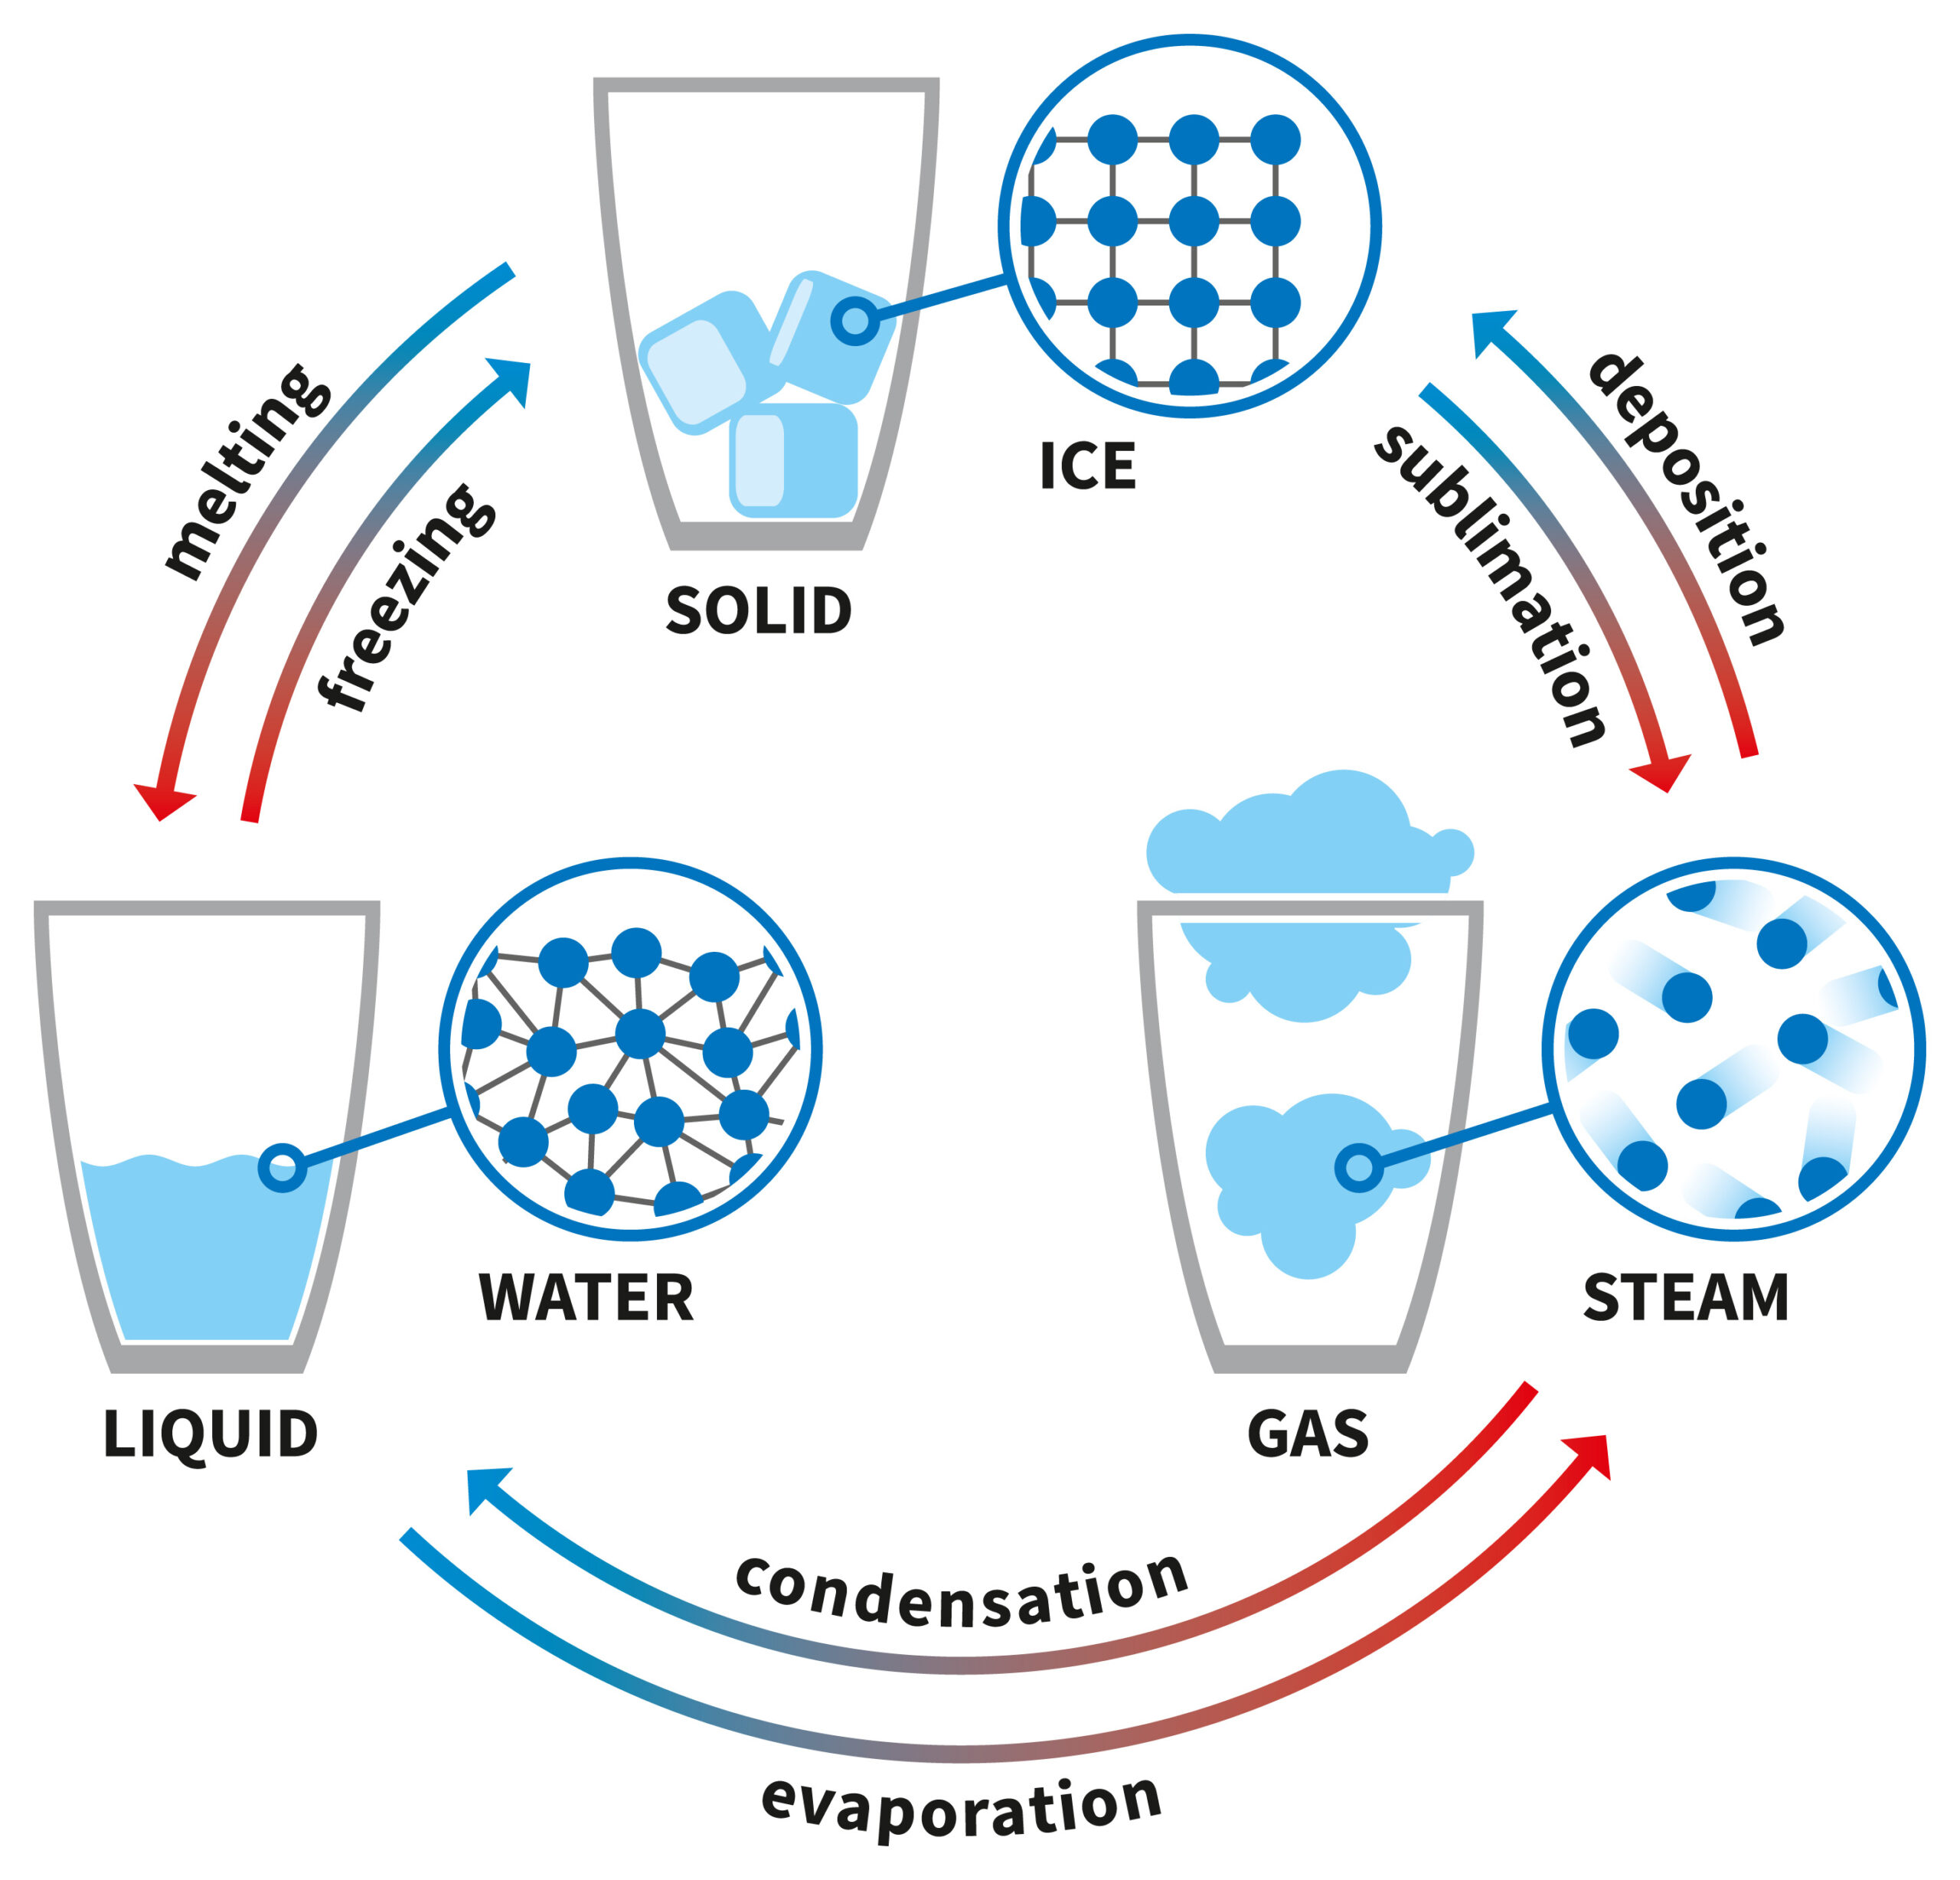
Explainer: What are the different states of matter?
Changing States Of Matter Diagram

Changing States Of Matter Diagram
Phases Of Matter Diagram A Model For The Different States Of Matter.
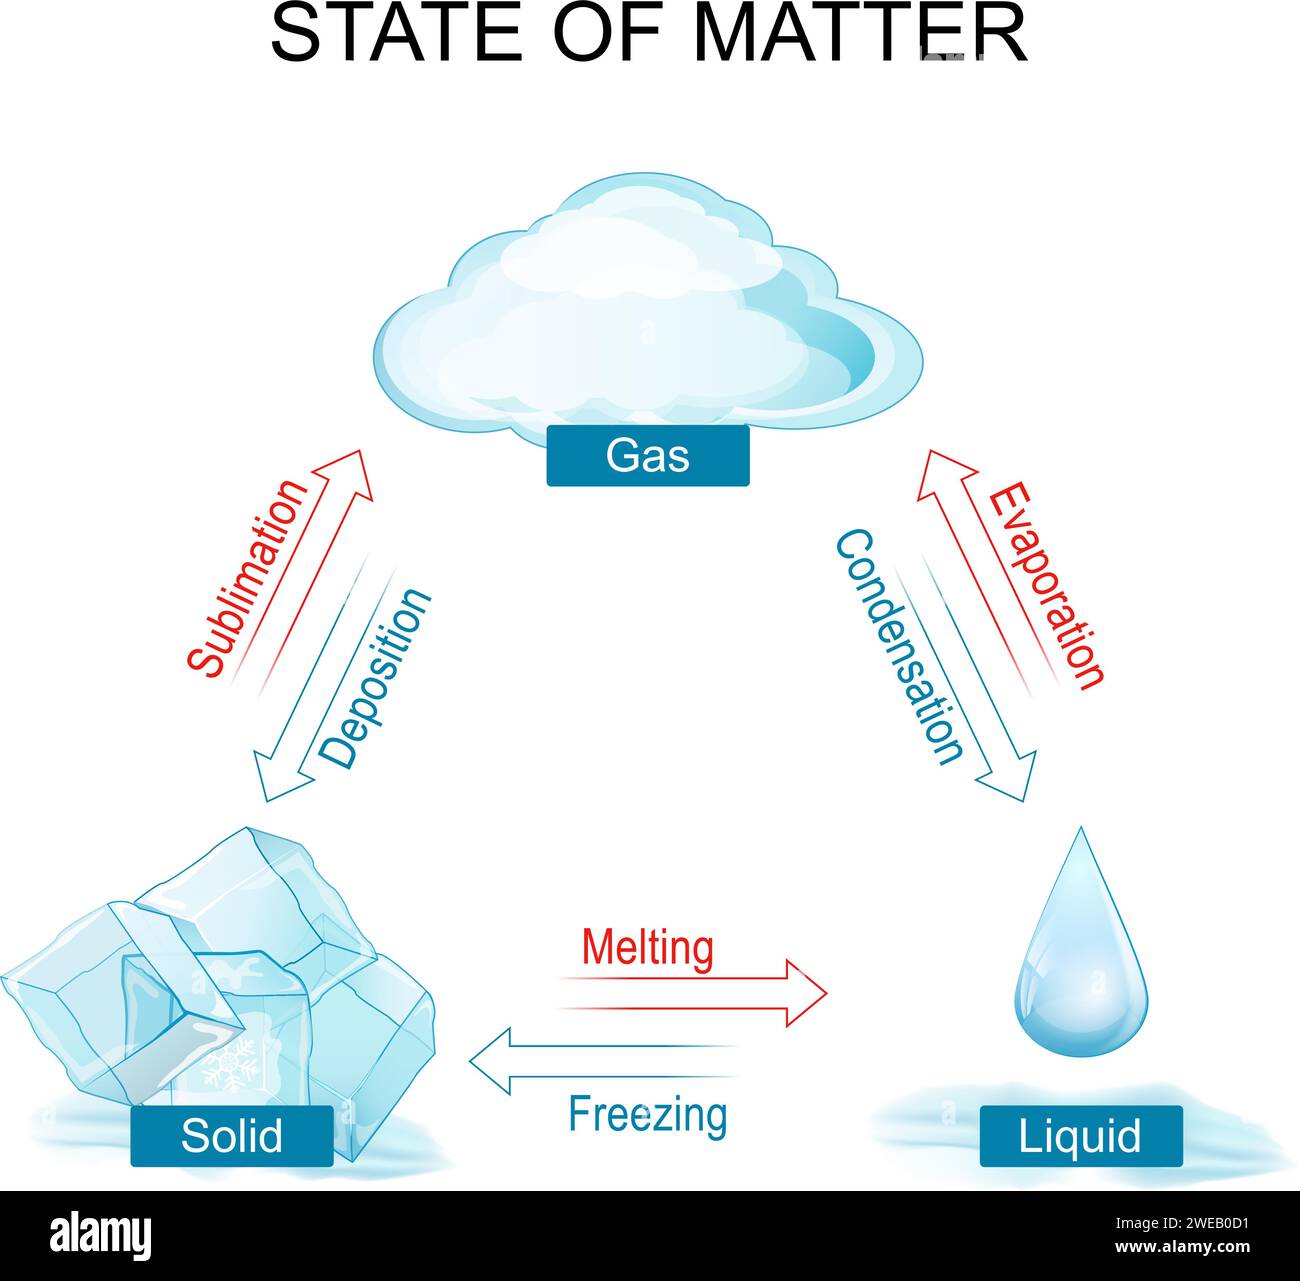
Phases Of Matter Diagram A Model For The Different States Of Matter.
Phases Of Matter Diagram A Model For The Different States Of Matter.
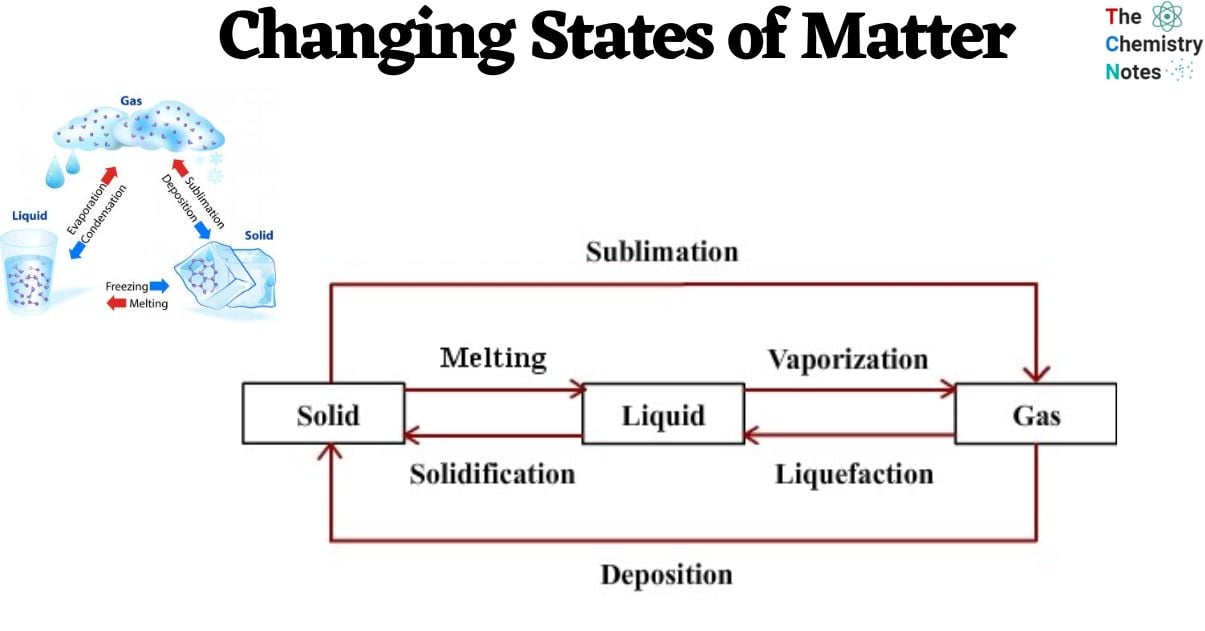
Phases Of Matter Diagram A Model For The Different States Of Matter.
States Of Matter | GCSE Chemistry Revision | KS4

States of Matter | GCSE Chemistry Revision | KS4
Changing States Of Matter Diagram

Changing States Of Matter Diagram
States Of Matter Diagram Hi-res Stock Photography And Images - Alamy
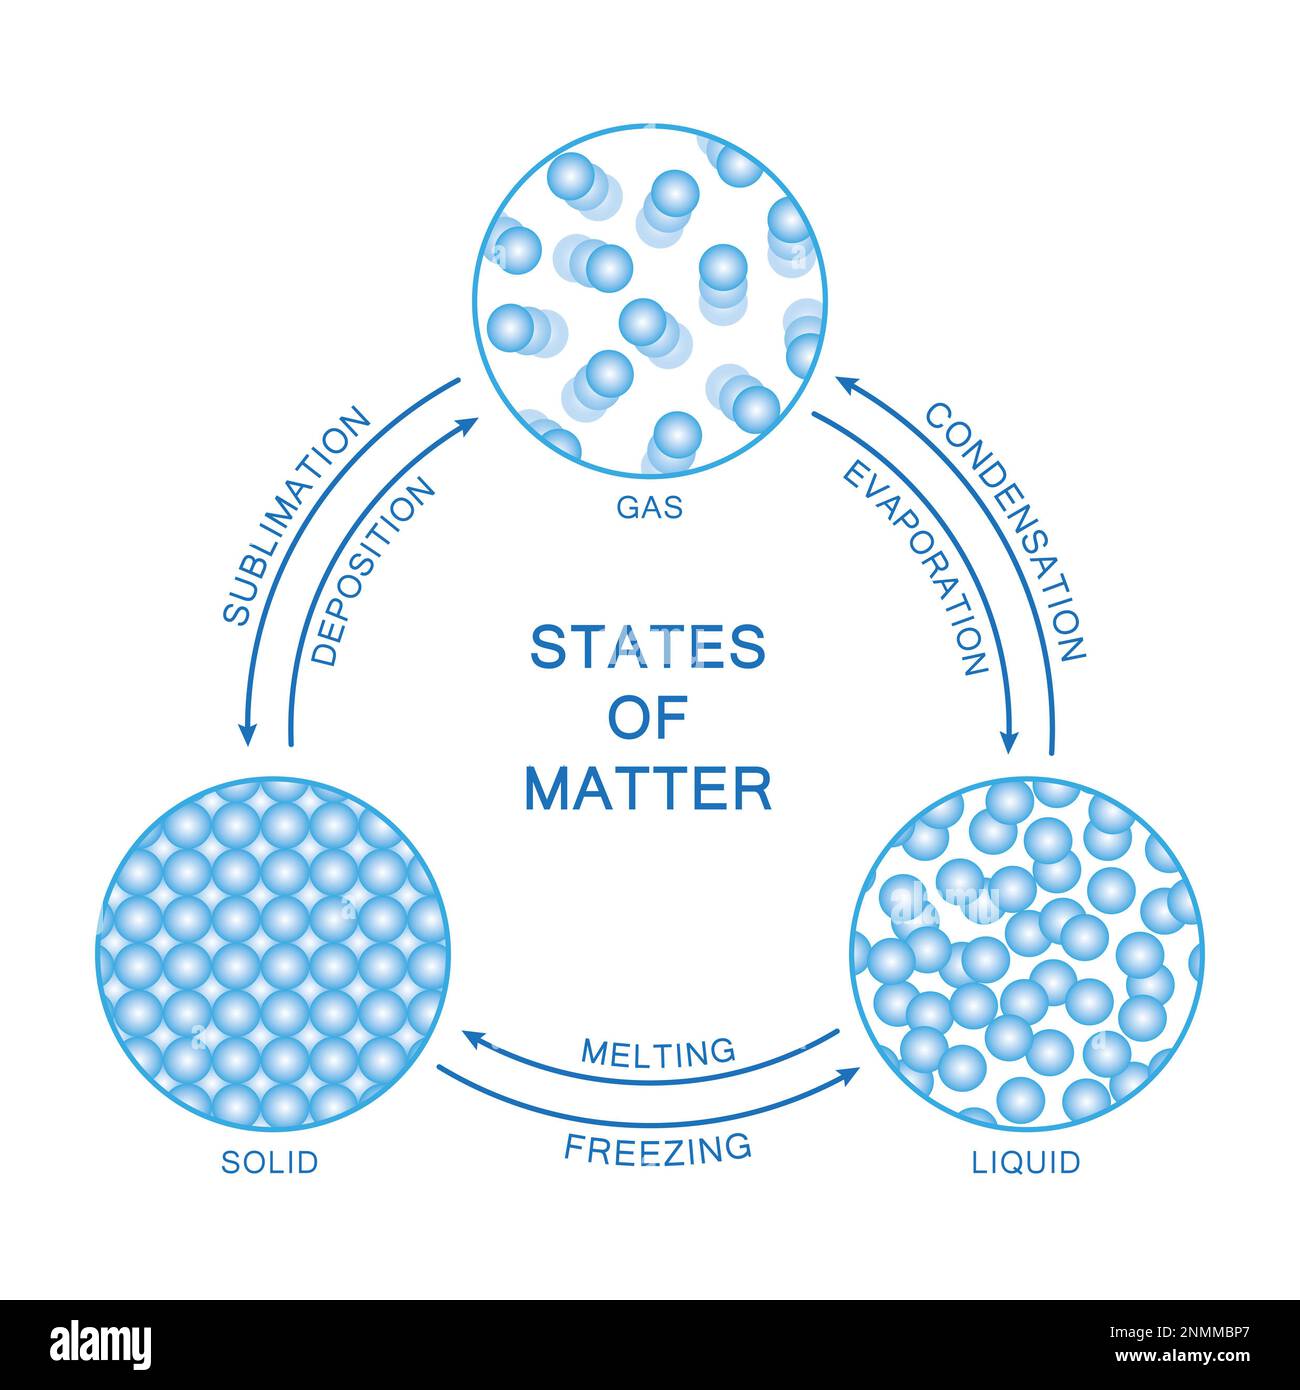
States of matter diagram hi-res stock photography and images - Alamy
Changing States Of Matter Diagram
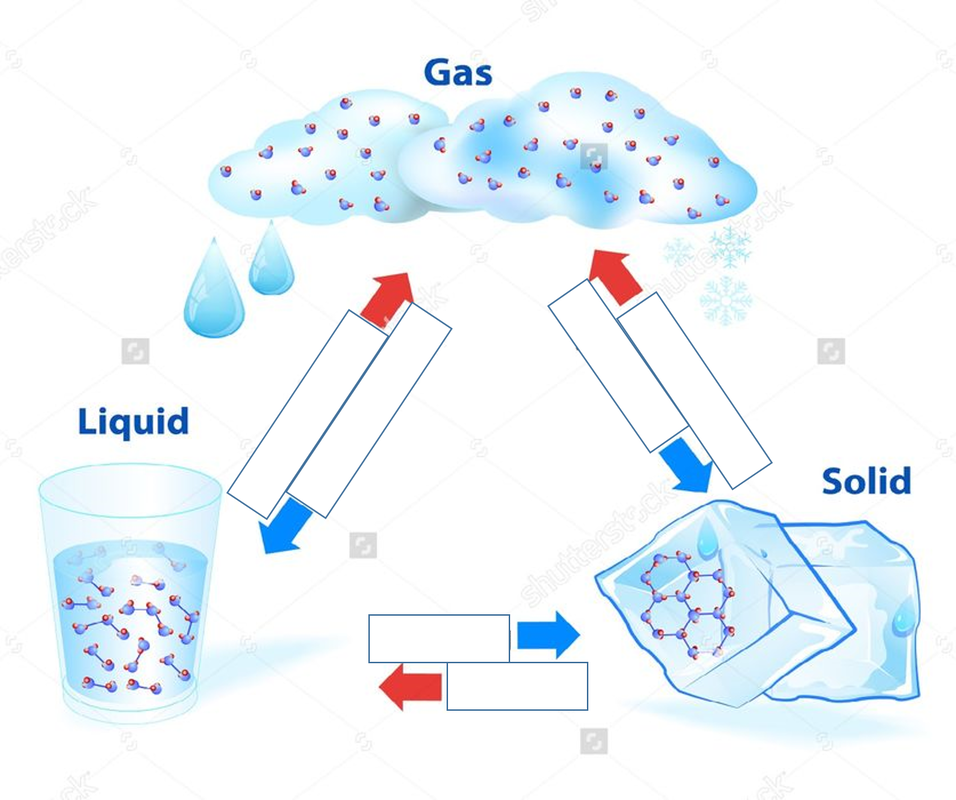
Changing States Of Matter Diagram
Changing States Of Matter Diagram
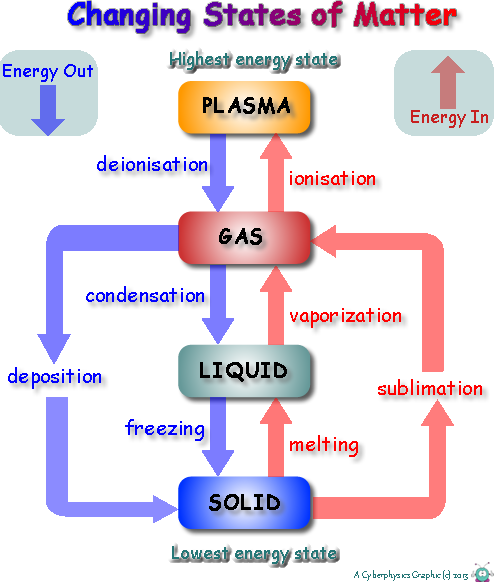
Changing States Of Matter Diagram
State Of Matter Definition Chemistry Glossary

State Of Matter Definition Chemistry Glossary
Diagram Showing The Changing States Of Matter Download PPT States Of
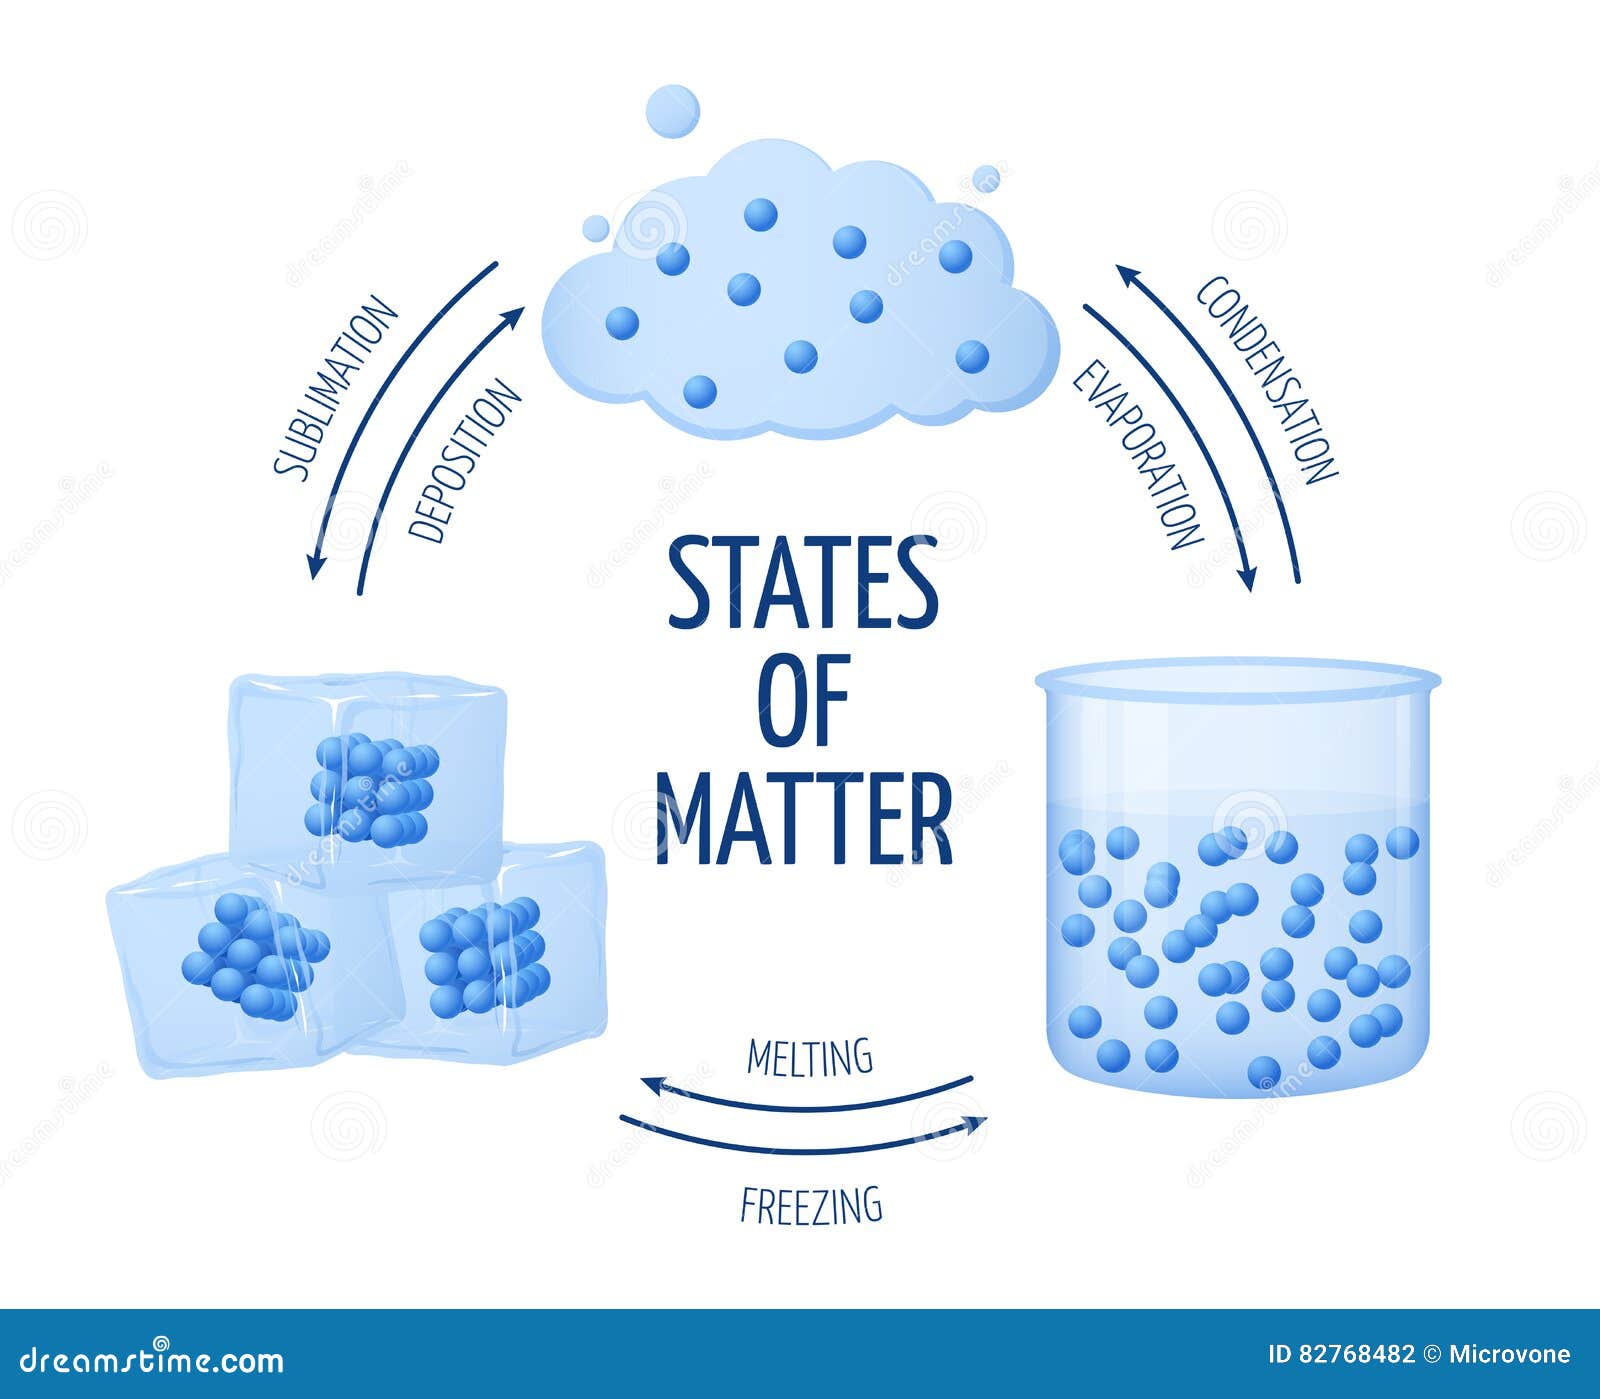
Diagram Showing The Changing States Of Matter Download PPT States Of
Phases Of Matter Diagram A Model For The Different States Of Matter.
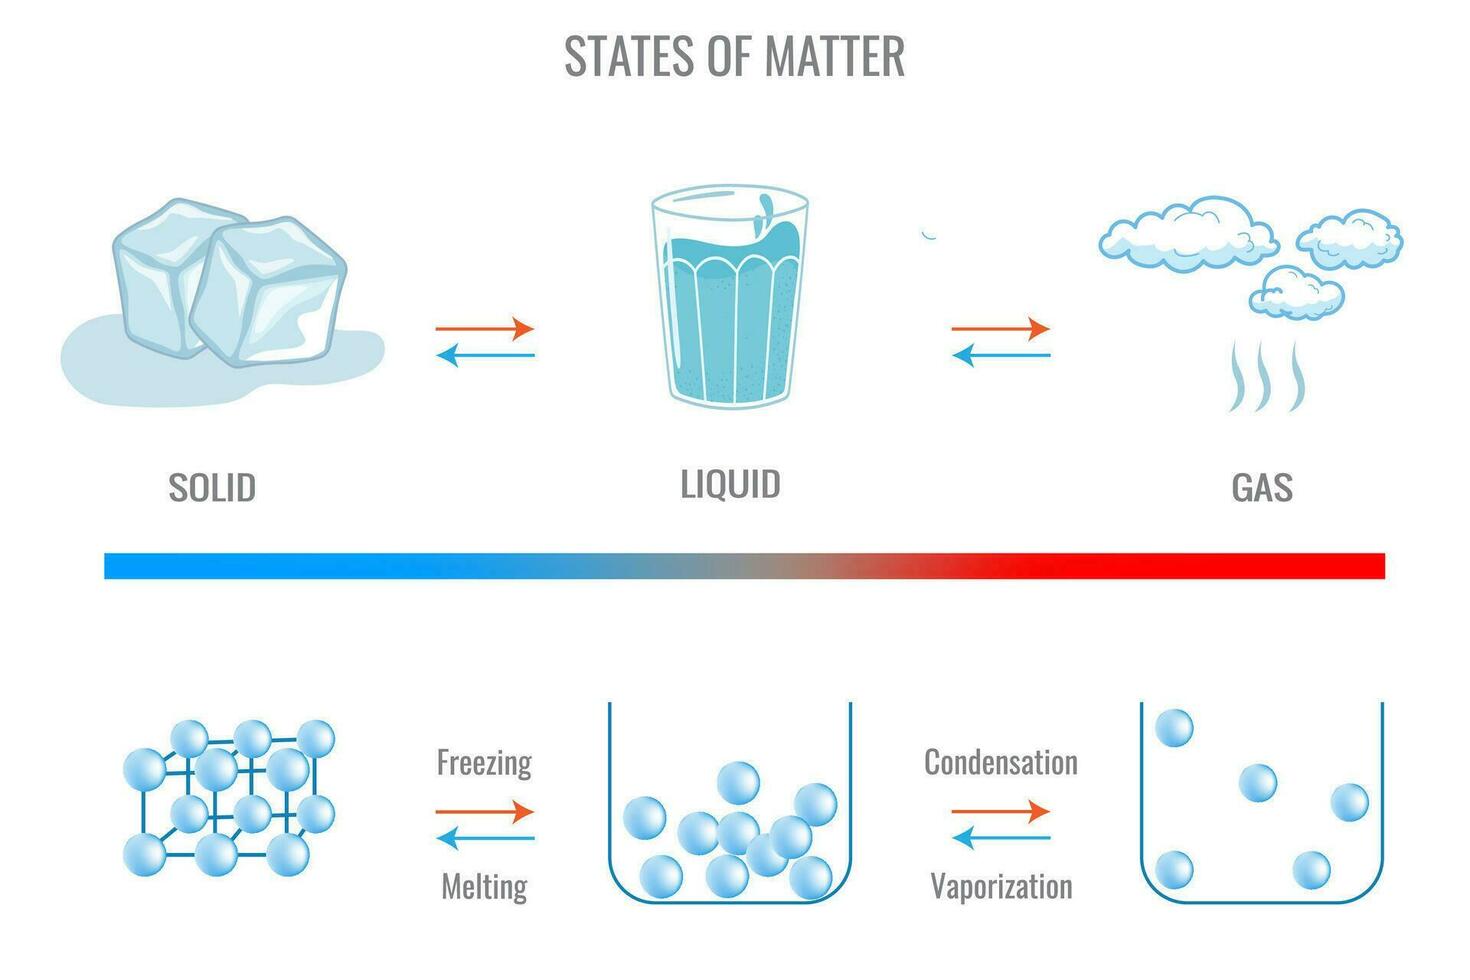
Phases Of Matter Diagram A Model For The Different States Of Matter.
CIE IGCSE Biology: 复习笔记:1.1.2 States Of Matter
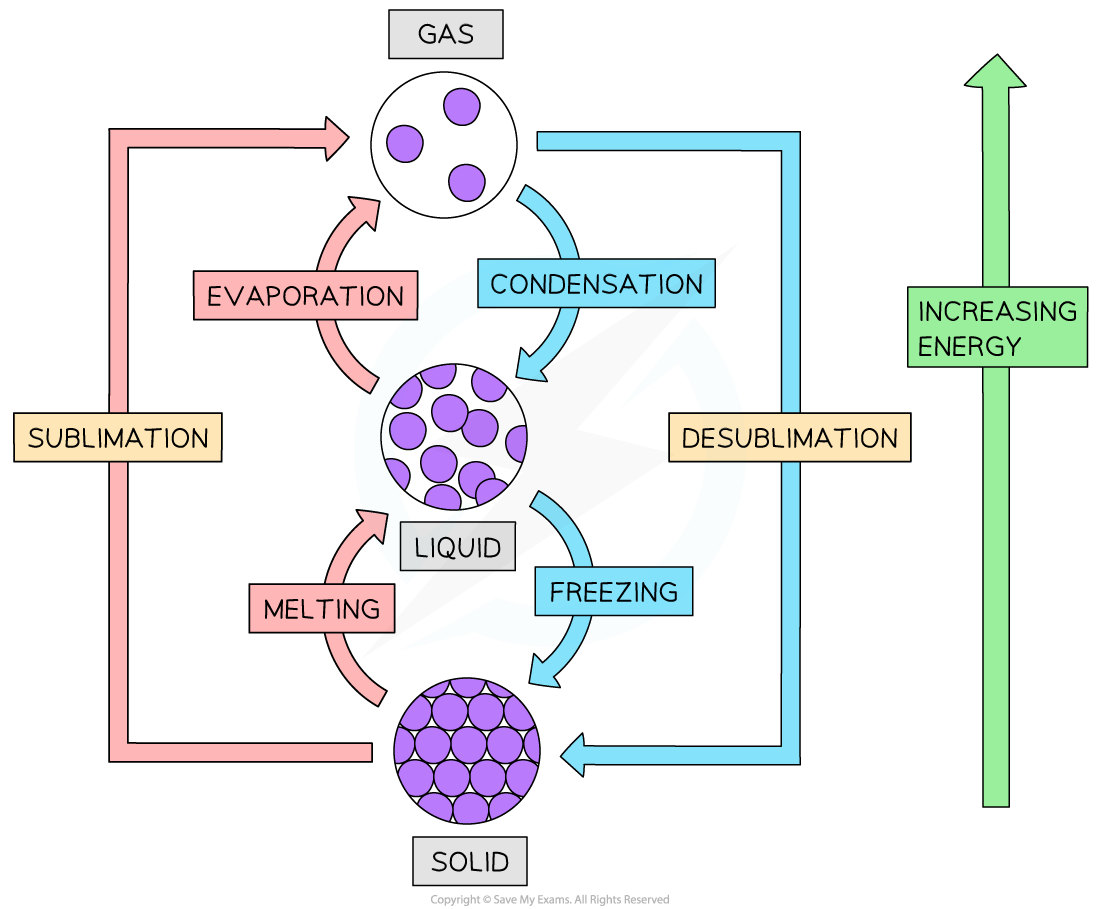
CIE IGCSE Biology: 复习笔记:1.1.2 States of Matter
States Of Matter Diagram: Solid, Liquid, And Gas

States of Matter Diagram: Solid, Liquid, and Gas
Phase Changes Of Matter Phase Changes Teaching Resources
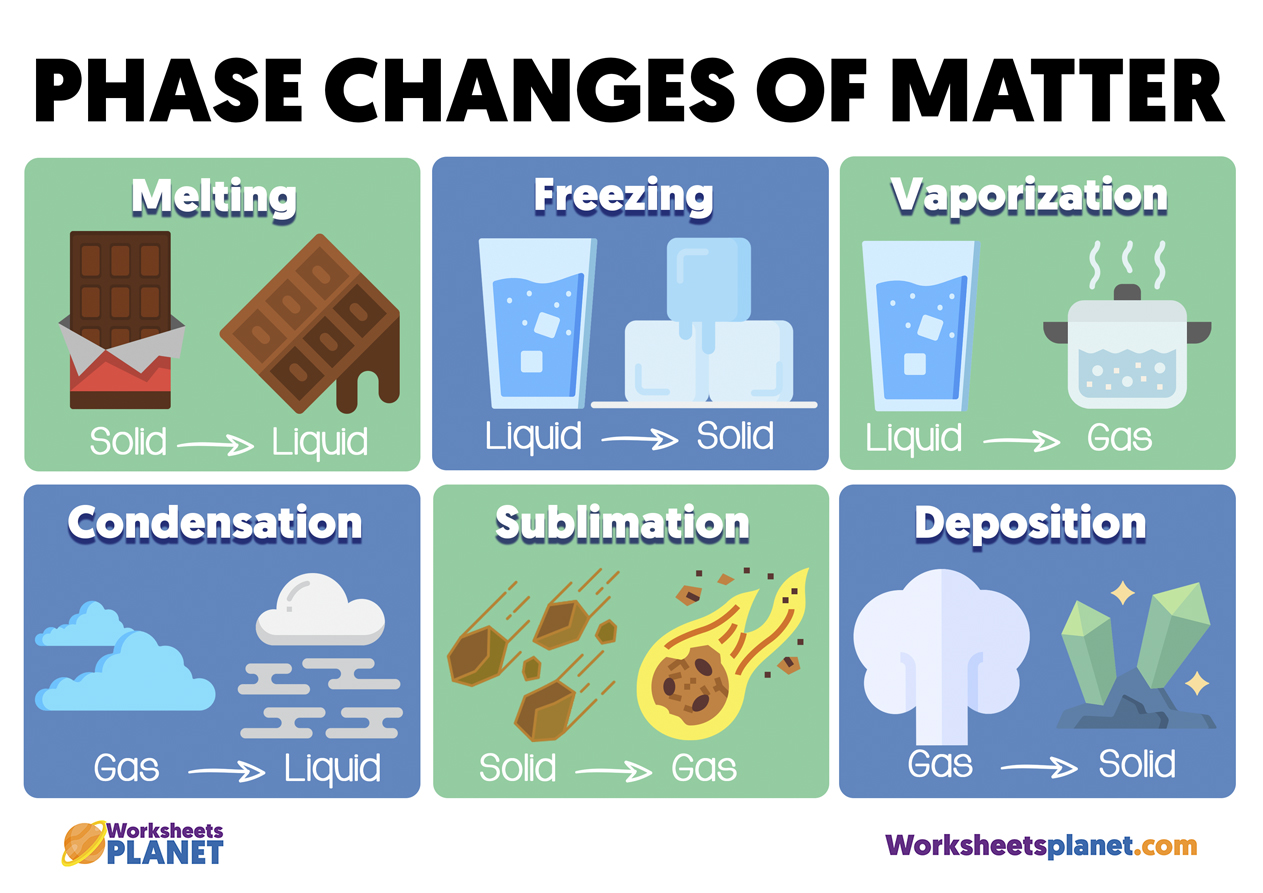
Phase Changes Of Matter Phase Changes Teaching Resources
Change Of State Of Matter
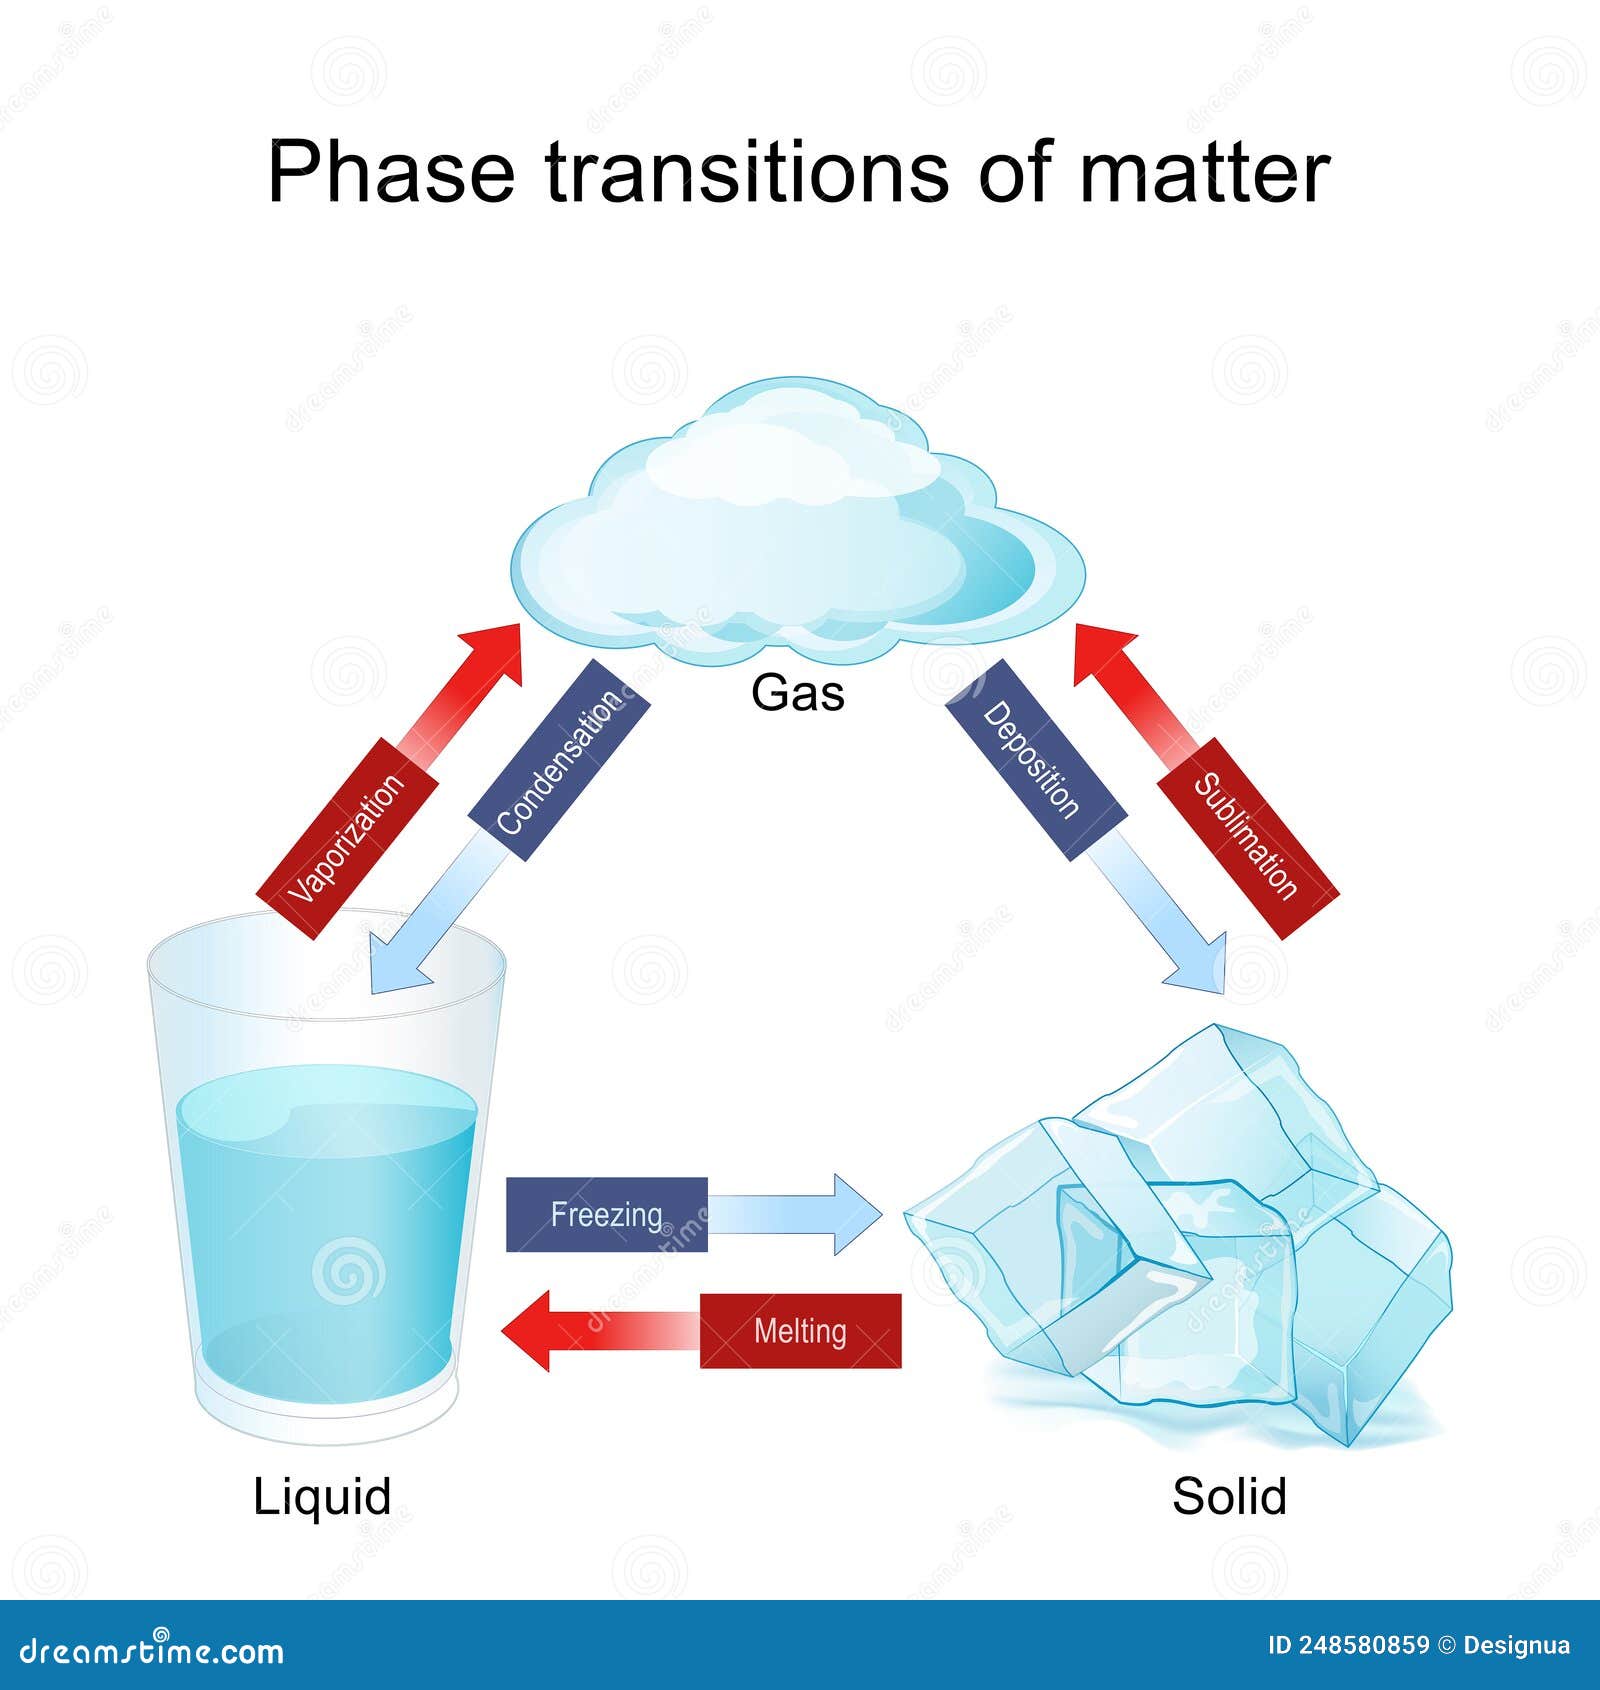
Change Of State Of Matter
Change Of State Diagram For Water
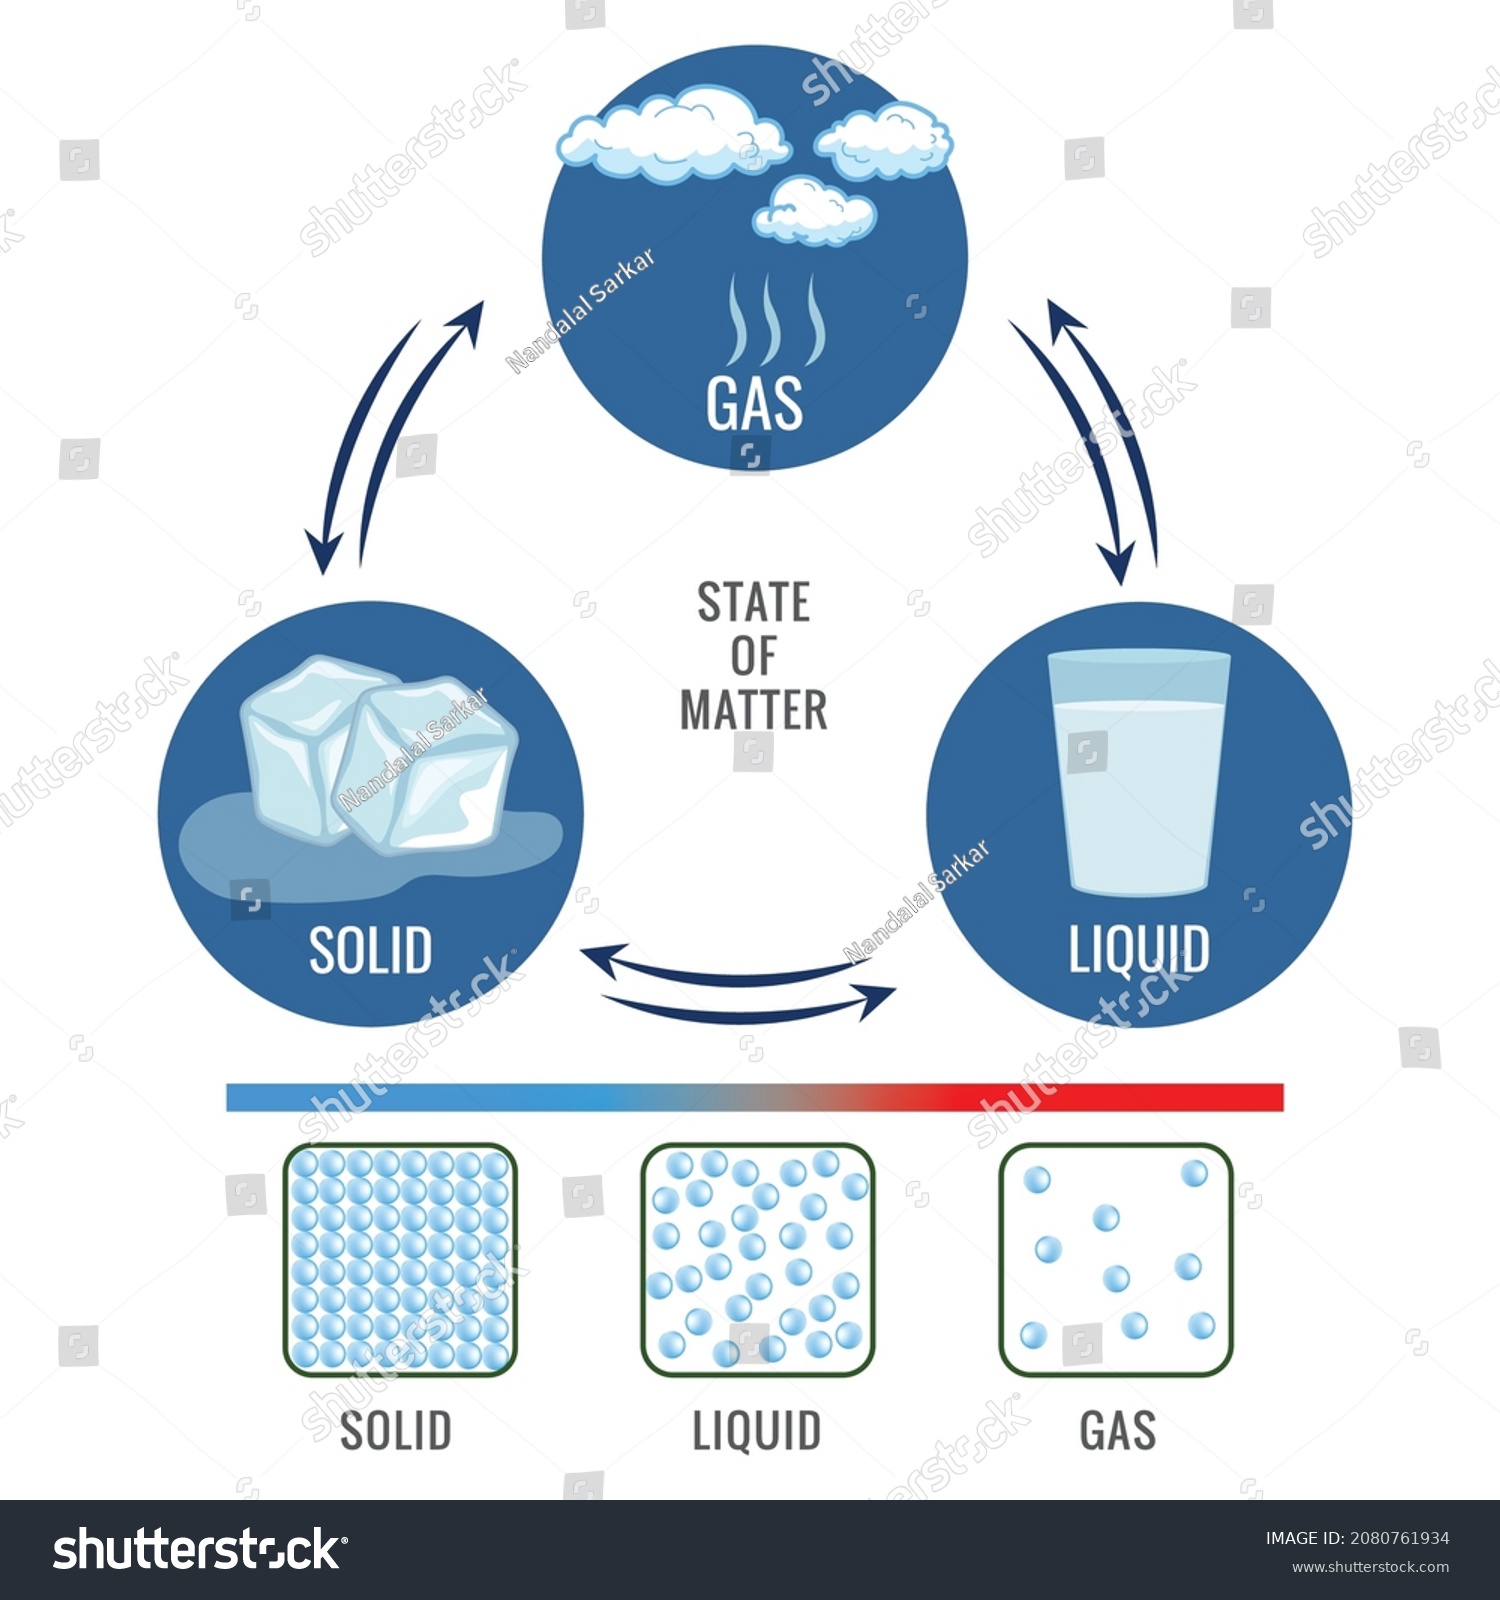
Change Of State Diagram For Water
States Of Matter Diagram Hi-res Stock Photography And Images - Alamy

States of matter diagram hi-res stock photography and images - Alamy
Changes Of State Diagram

Changes Of State Diagram
The Ultimate Guide: Understanding State Of Matter Changes Diagrams

The Ultimate Guide: Understanding State of Matter Changes Diagrams
Changes Of States Of Matter Diagram

Changes Of States Of Matter Diagram
Changes Of State Of Matter
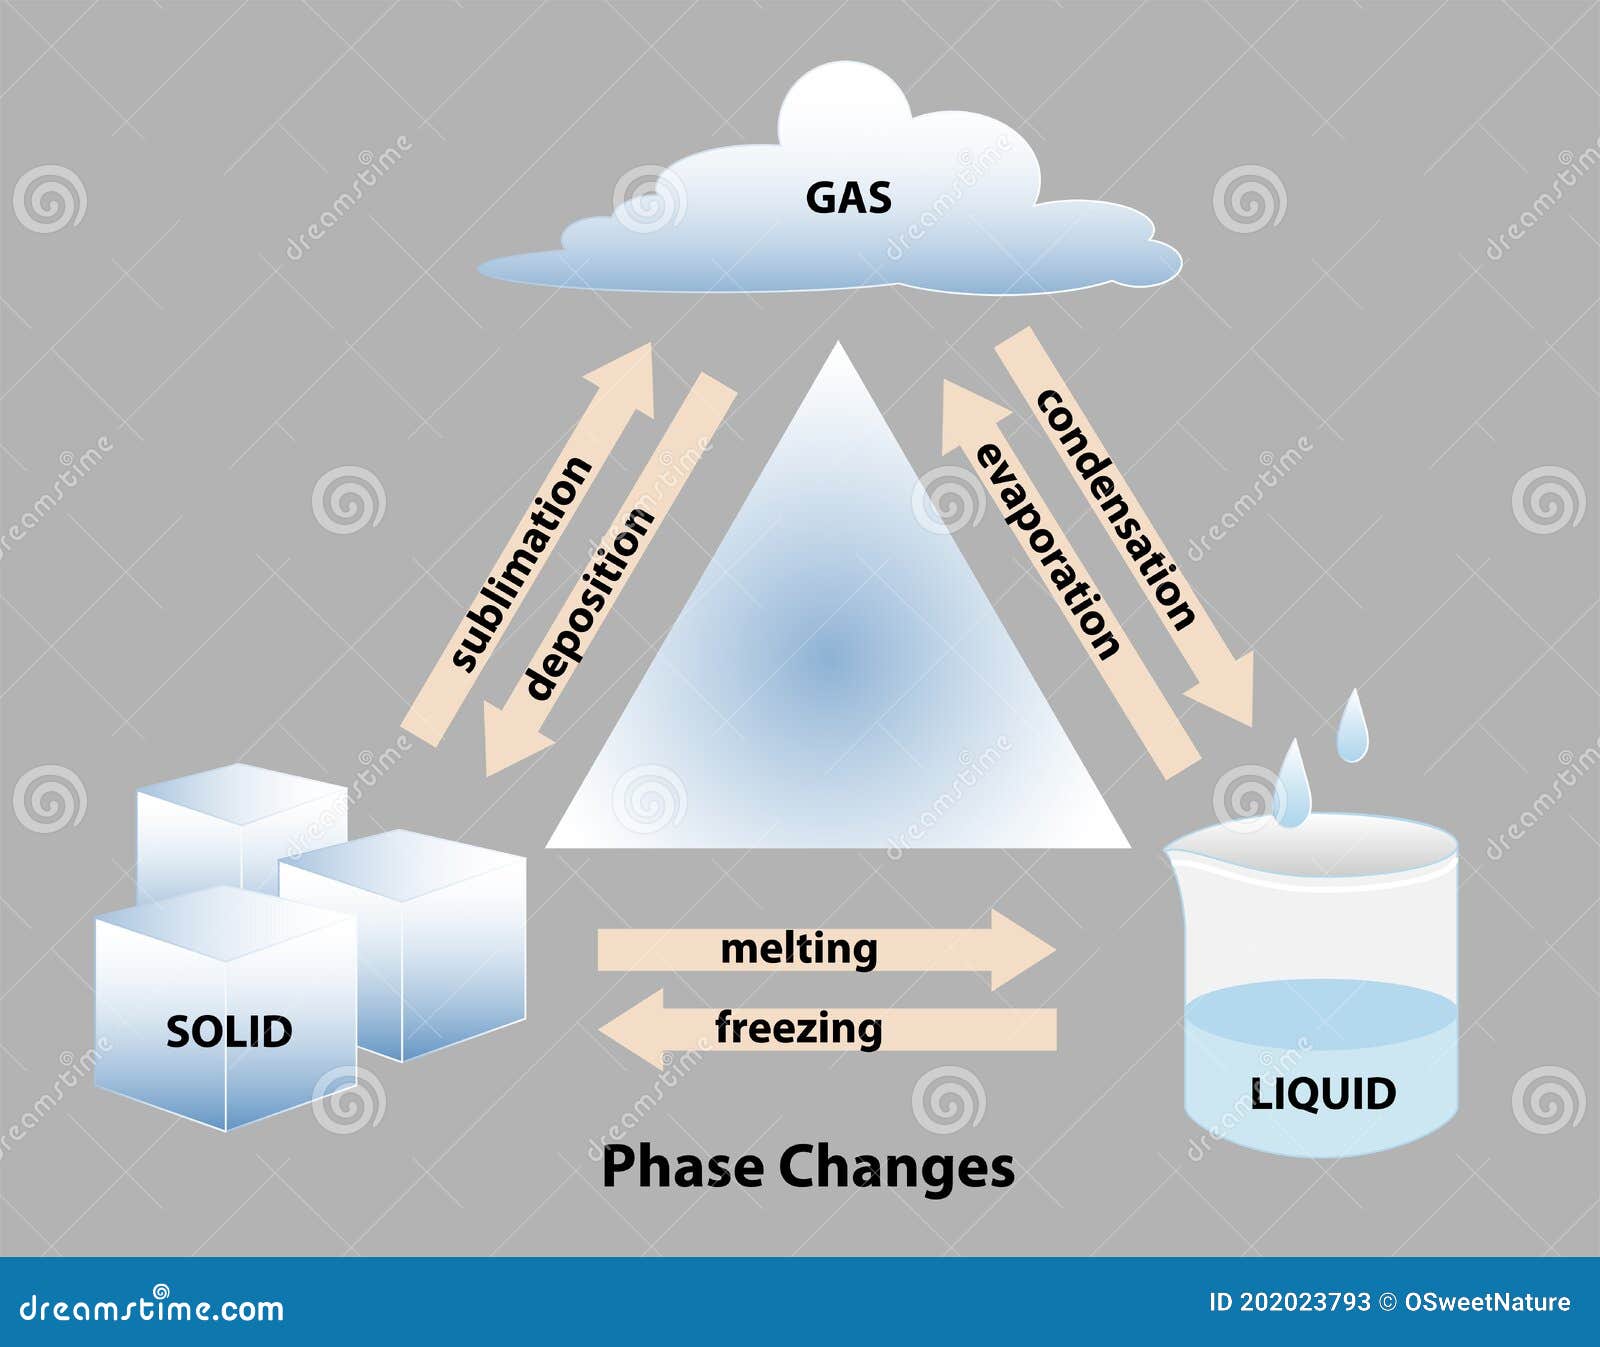
Changes Of State Of Matter
Changing States Of Matter : Solid, Liquid,Gas, Phase Change
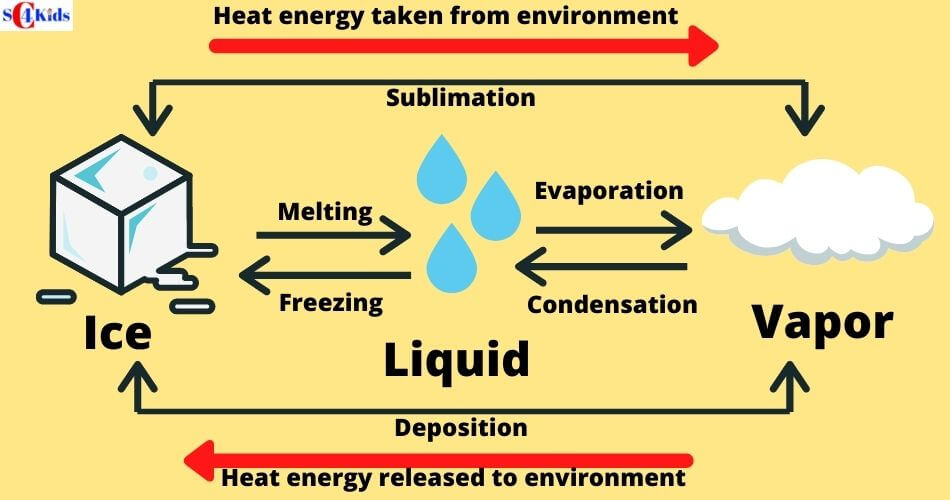
Changing States of Matter : Solid, Liquid,Gas, Phase Change
Changing States Of Matter Solid, Liquid, Gas, Phase Changes & Examples

Changing States of Matter Solid, Liquid, Gas, Phase Changes & Examples
Changing States Of Matter - Solid, Liquid And Gas | Phase Change

Changing States Of Matter - Solid, Liquid And Gas | Phase Change