Understanding the Diagram of a Mass Spectrometer: A Visual Guide
Ever wondered how scientists turn tiny particles into data that can reveal the secrets of a molecule? In this guide you’ll learn the fundamental layout of a mass spectrometer, the role each component plays, and how the entire system turns chemical information into a clear, interpretable spectrum. By the end, you’ll feel confident navigating the schematic of this powerful analytical instrument.
1. Ionization Chamber: The First Step in the Journey
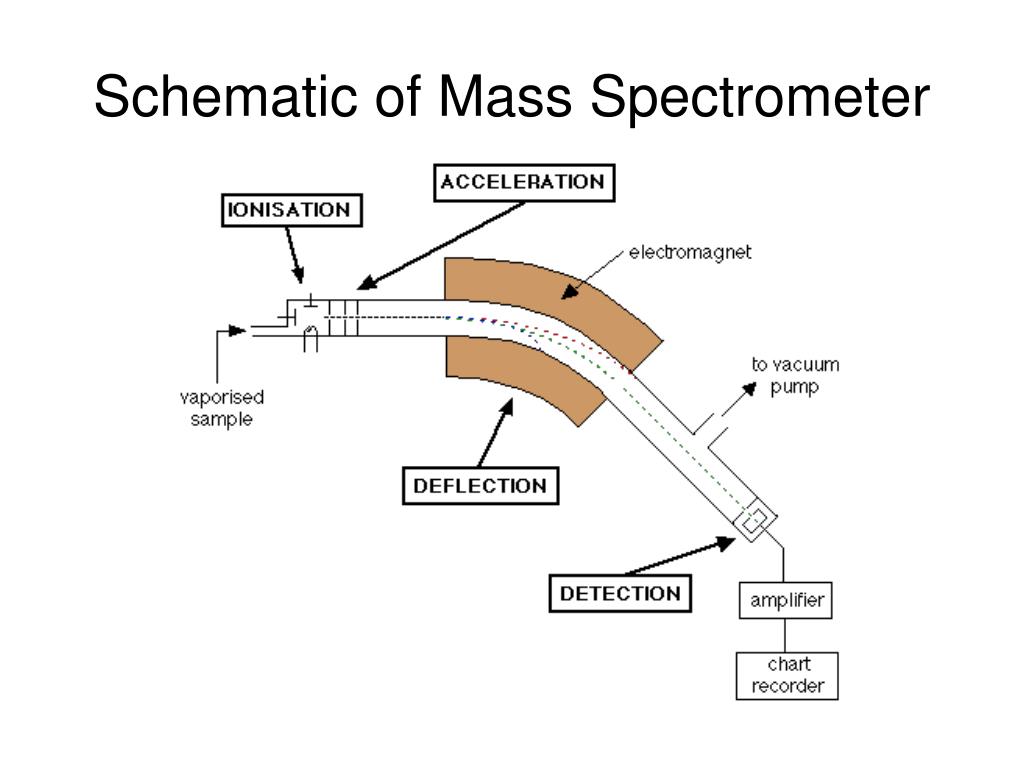
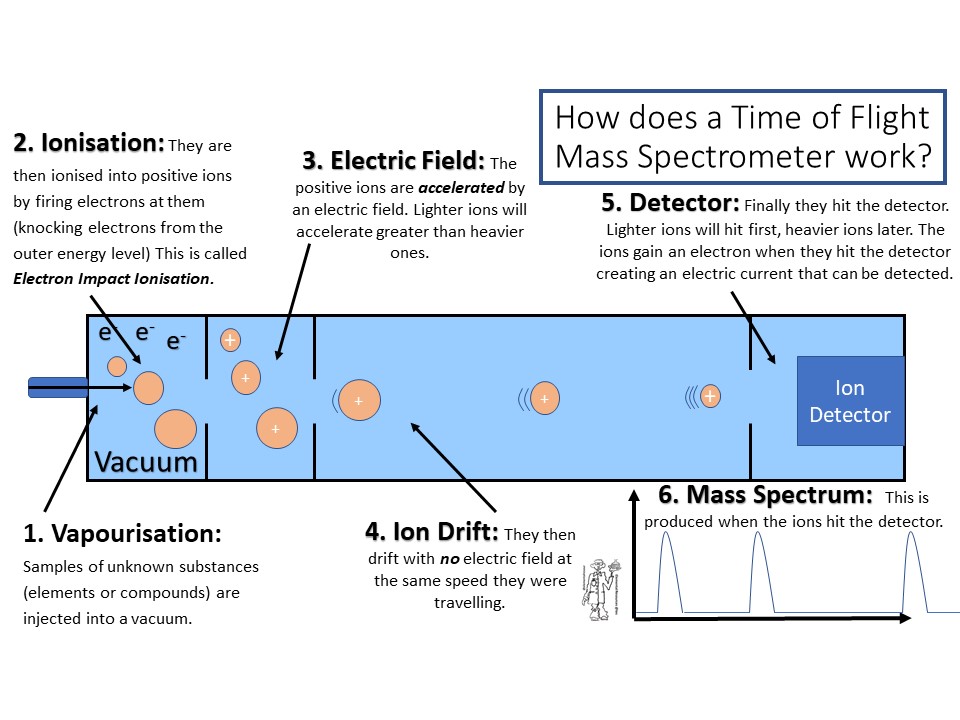
All mass spectrometry begins with ionization. In the ion source, neutral molecules are converted into charged ions—usually by adding or removing an electron. Common ionization methods include Electron Ionization (EI), Electrospray Ionization (ESI), and Matrix-Assisted Laser Desorption/Ionization (MALDI). Each method is chosen based on the analyte’s volatility, polarity, and desired information. The ion source is often a small, highly controlled region where the sample is introduced and energized.

2. Mass Analyzer: Sorting Ions by Their Mass-to-Charge Ratio
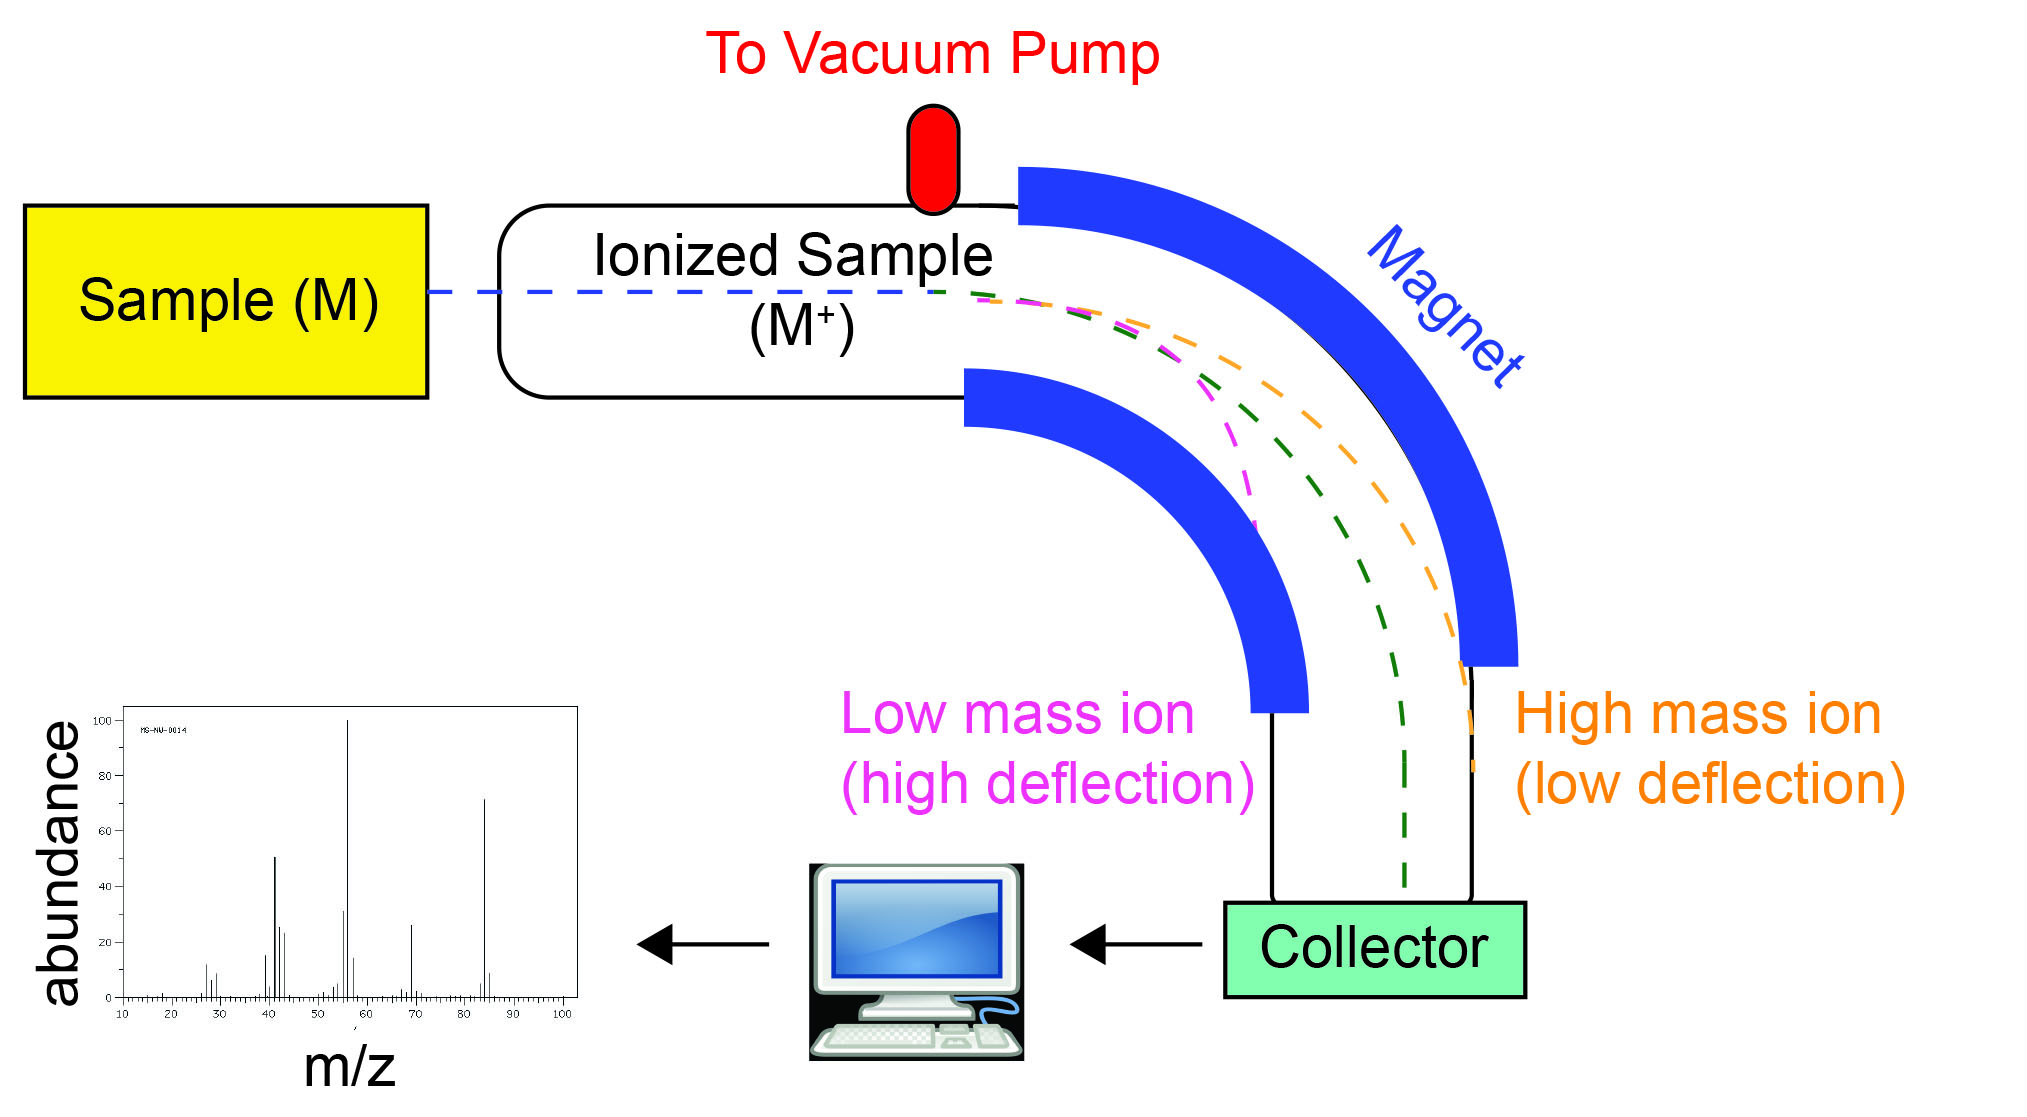
Once ionized, particles are funneled into the mass analyzer. Here they are separated according to their mass-to-charge (m/z) ratio. Common analyzers include Quadrupole, Time-of-Flight (TOF), Ion Trap, and Orbitrap. The choice of analyzer depends on resolution, mass range, and sensitivity required for the experiment. Each analyzer uses different physical principles—electric fields, magnetic fields, or time measurements—to achieve separation.
In many instruments, the analyzer sits immediately after the ion source. As ions pass through, only those with specific m/z values reach the detector, producing a clear, distinct signal.
3. Detector: Capturing the Ions
The final component is the detector, which records the separated ions and converts them into an electrical signal. Common detectors include Microchannel Plates (MCP) and Photomultiplier Tubes (PMT). The output is a mass spectrum—a graph of signal intensity versus m/z. Peaks in this graph correspond to specific ionized molecules, allowing chemists to deduce composition and structure.
Some systems employ a tandem setup (MS/MS) where a first analyzer selects ions, fragments them, and a second analyzer resolves the fragments. This provides deeper insight into molecular structure.
4. Data Acquisition and Interpretation
The detector’s electrical output is digitized and processed by a computer. Advanced software performs peak integration, calibration, and compound identification. Databases and libraries allow matching of observed m/z values to known compounds, facilitating rapid identification in complex mixtures.
5. Common Variations and Enhancements
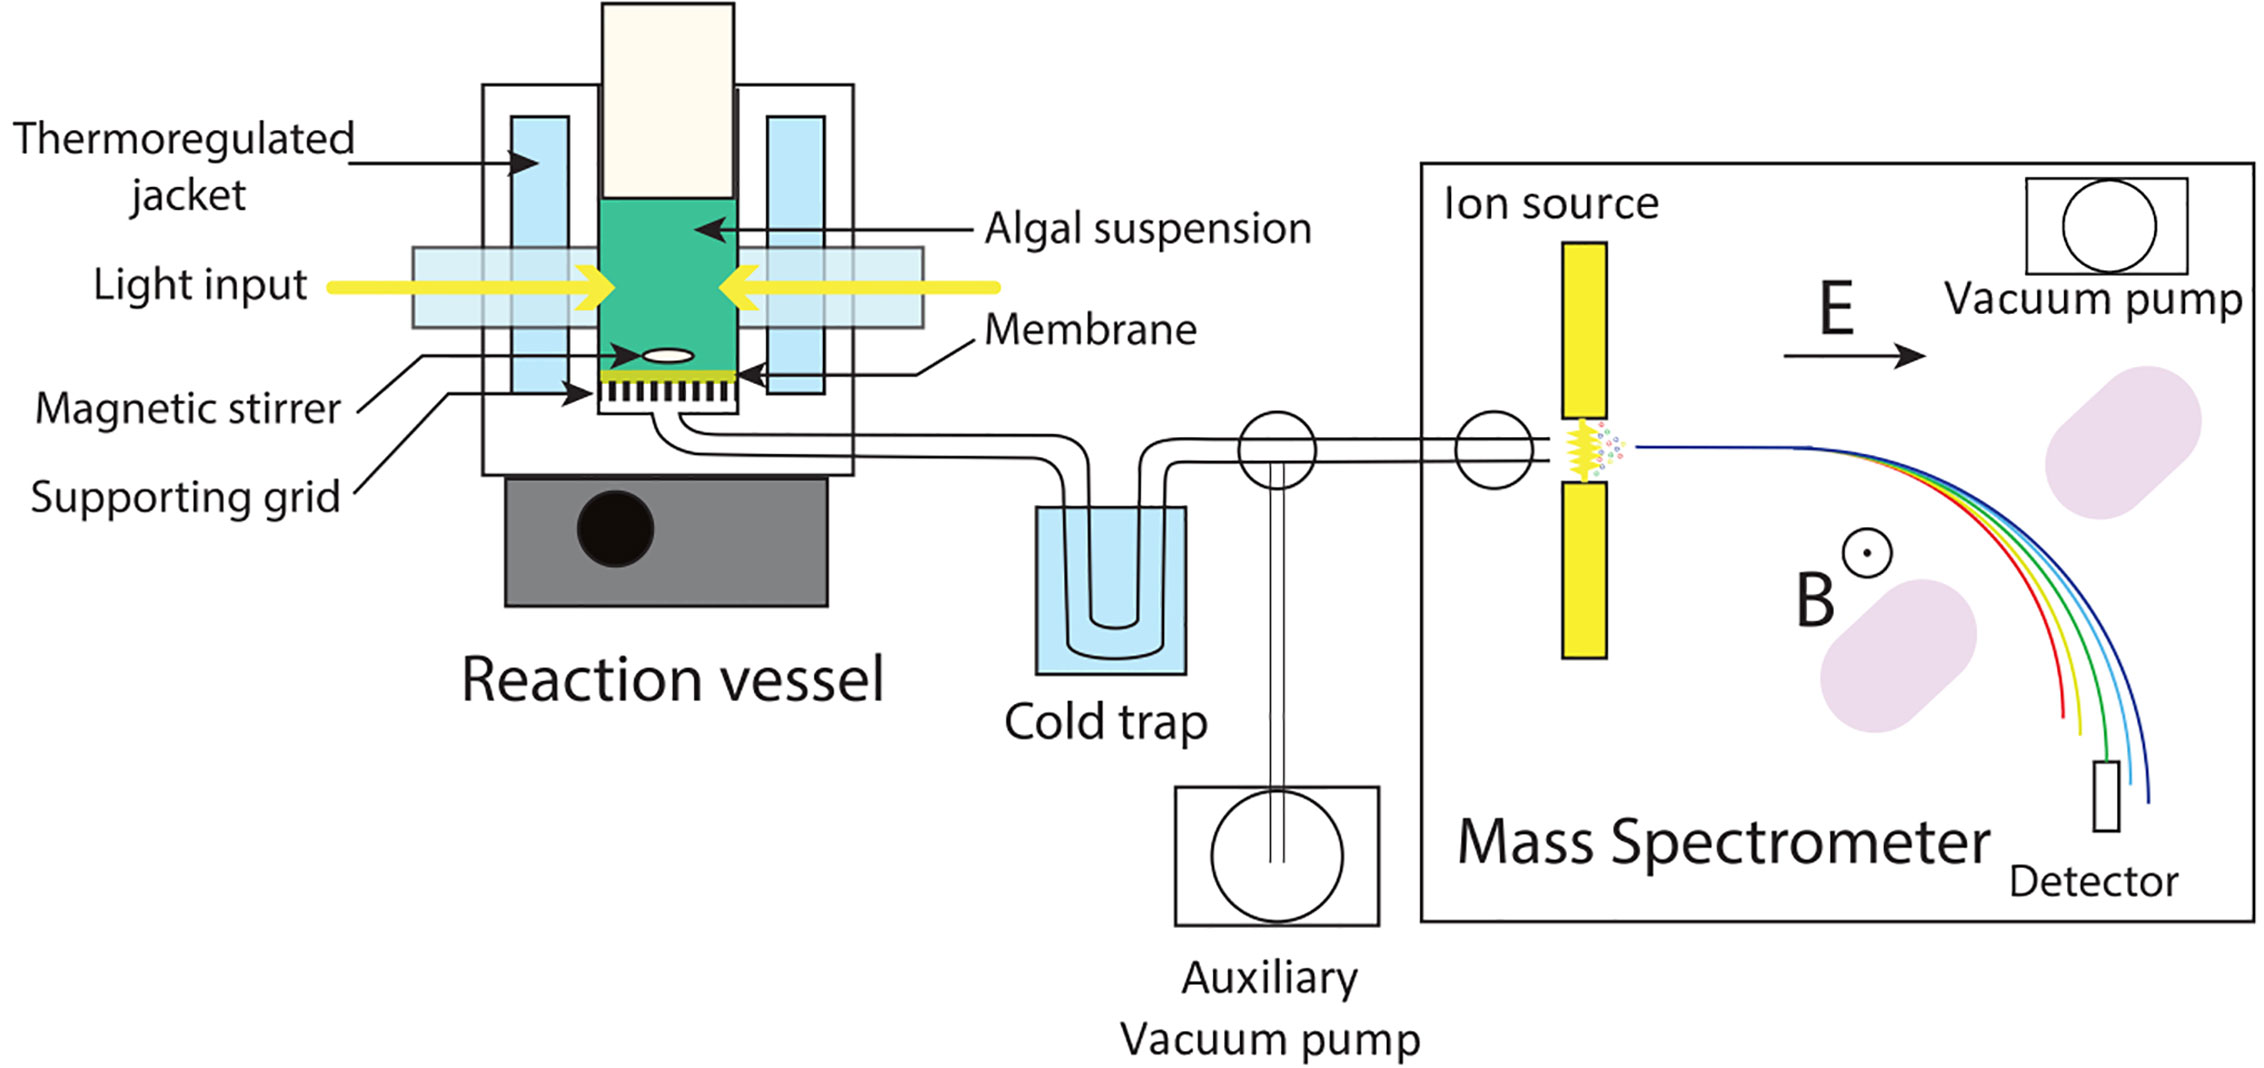
Modern mass spectrometers often integrate additional modules: a chromatographic column (GC or LC) for separation before ionization, a sample introduction system, or a collision cell for fragmentation. These enhancements improve selectivity, reduce noise, and increase the breadth of analyzable compounds.
In a typical GC–MS setup, a gas chromatograph first separates a mixture; the effluent enters the ion source, where the molecules are ionized and sent to the mass analyzer. The resulting spectrum is then correlated with retention times, enabling precise identification of compounds in complex samples.
6. Visualizing the Workflow
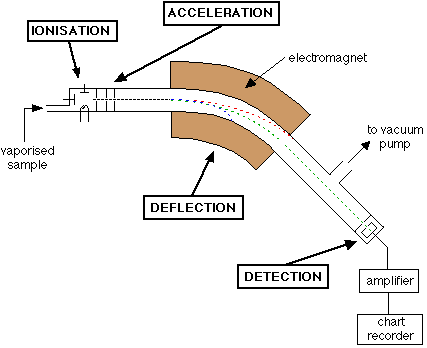
Below is a concise representation of a typical mass spectrometer’s workflow:

In this image, you can see the path of ions from the sample source, through the ion optics, into the mass analyzer, and finally to the detector. Each stage is essential for accurate mass determination.
7. Practical Tips for Beginners
- Sample Preparation: Clean samples reduce background noise. Use solvents compatible with your ionization technique.
- Calibration: Regularly calibrate the mass analyzer using standard compounds to ensure accurate m/z values.
- Maintenance: Keep the ion source and detector clean. Replace consumables like filaments or gases as recommended.
- Data Analysis: Familiarize yourself with peak deconvolution and compound libraries. Software tutorials can accelerate learning.
Conclusion
A mass spectrometer is a marvel of modern science—converting microscopic ions into meaningful data. By understanding the core components—ion source, mass analyzer, detector, and data acquisition—you can appreciate how each piece works in harmony to reveal molecular identities. Whether you’re a student, researcher, or curious hobbyist, mastering the schematic of a mass spectrometer opens the door to countless analytical possibilities. Happy analyzing!
Spectrometer Diagram

Spectrometer Diagram
Magnetic Sector Mass Spectrometer: Working And Applications

Magnetic Sector Mass Spectrometer: Working and Applications
Highly Schematic Diagram Of Mass Spectrometry
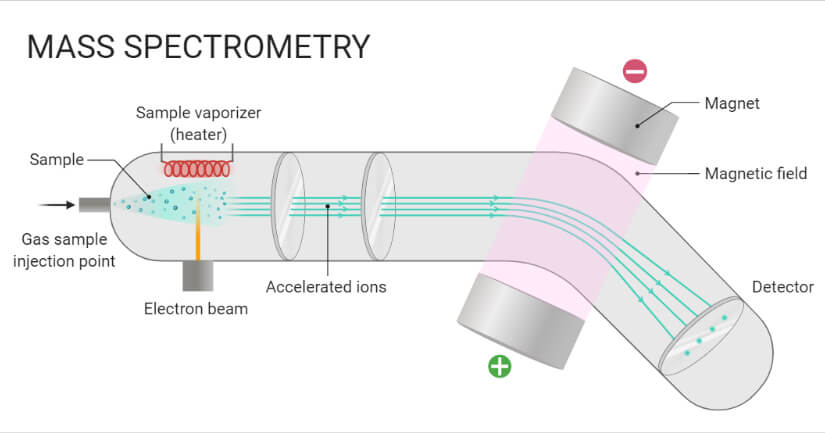
Highly Schematic Diagram Of Mass Spectrometry
Schematic Diagram Of A Mass Spectrometer

Schematic Diagram Of A Mass Spectrometer
Schematic Drawing Of Mass Spectrometer - Circuit Diagram

Schematic Drawing Of Mass Spectrometer - Circuit Diagram
Mass Spectrometer Schematic 15.9.1: More Fragmentation Chemistry

Mass Spectrometer Schematic 15.9.1: More Fragmentation Chemistry
Draw A Well Labeled Diagram Of Mass Spectrometer At Herman Stpierre Blog
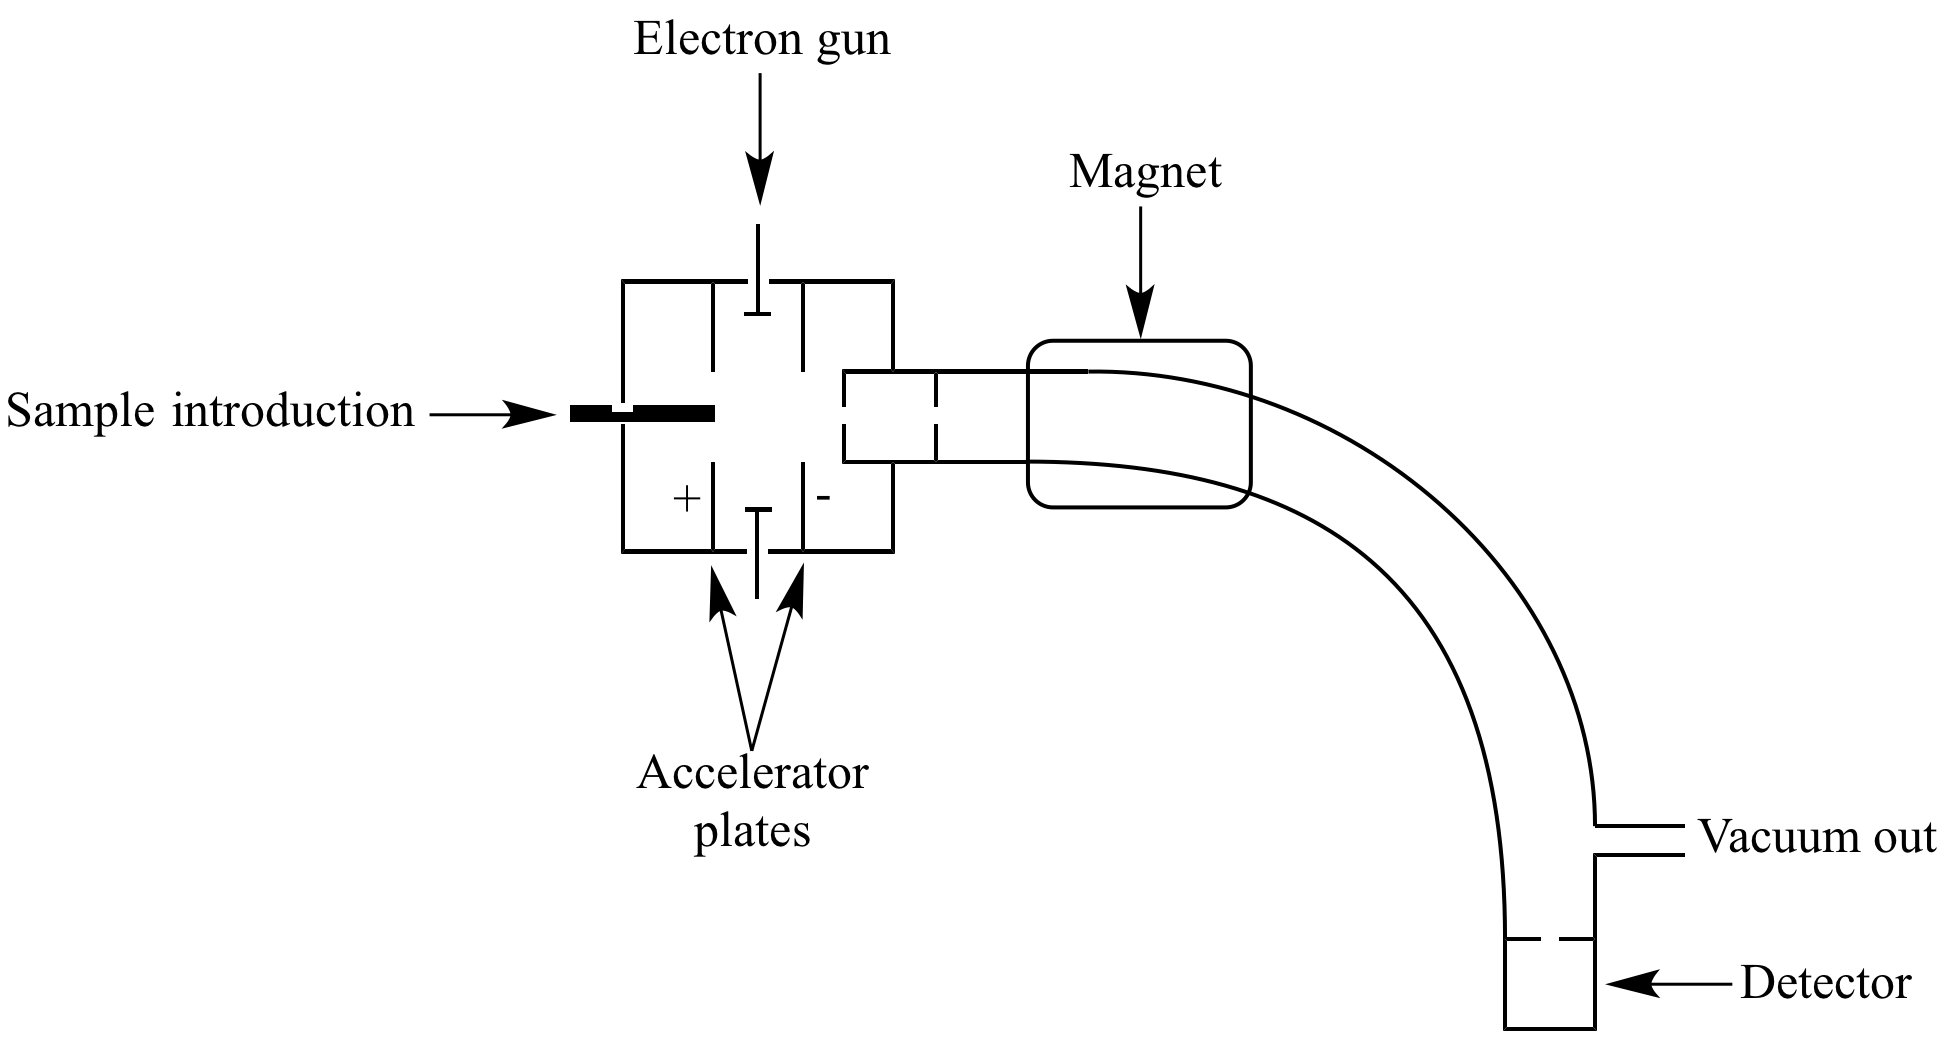
Draw A Well Labeled Diagram Of Mass Spectrometer at Herman Stpierre blog
Draw A Well Labeled Diagram Of Mass Spectrometer At Herman Stpierre Blog
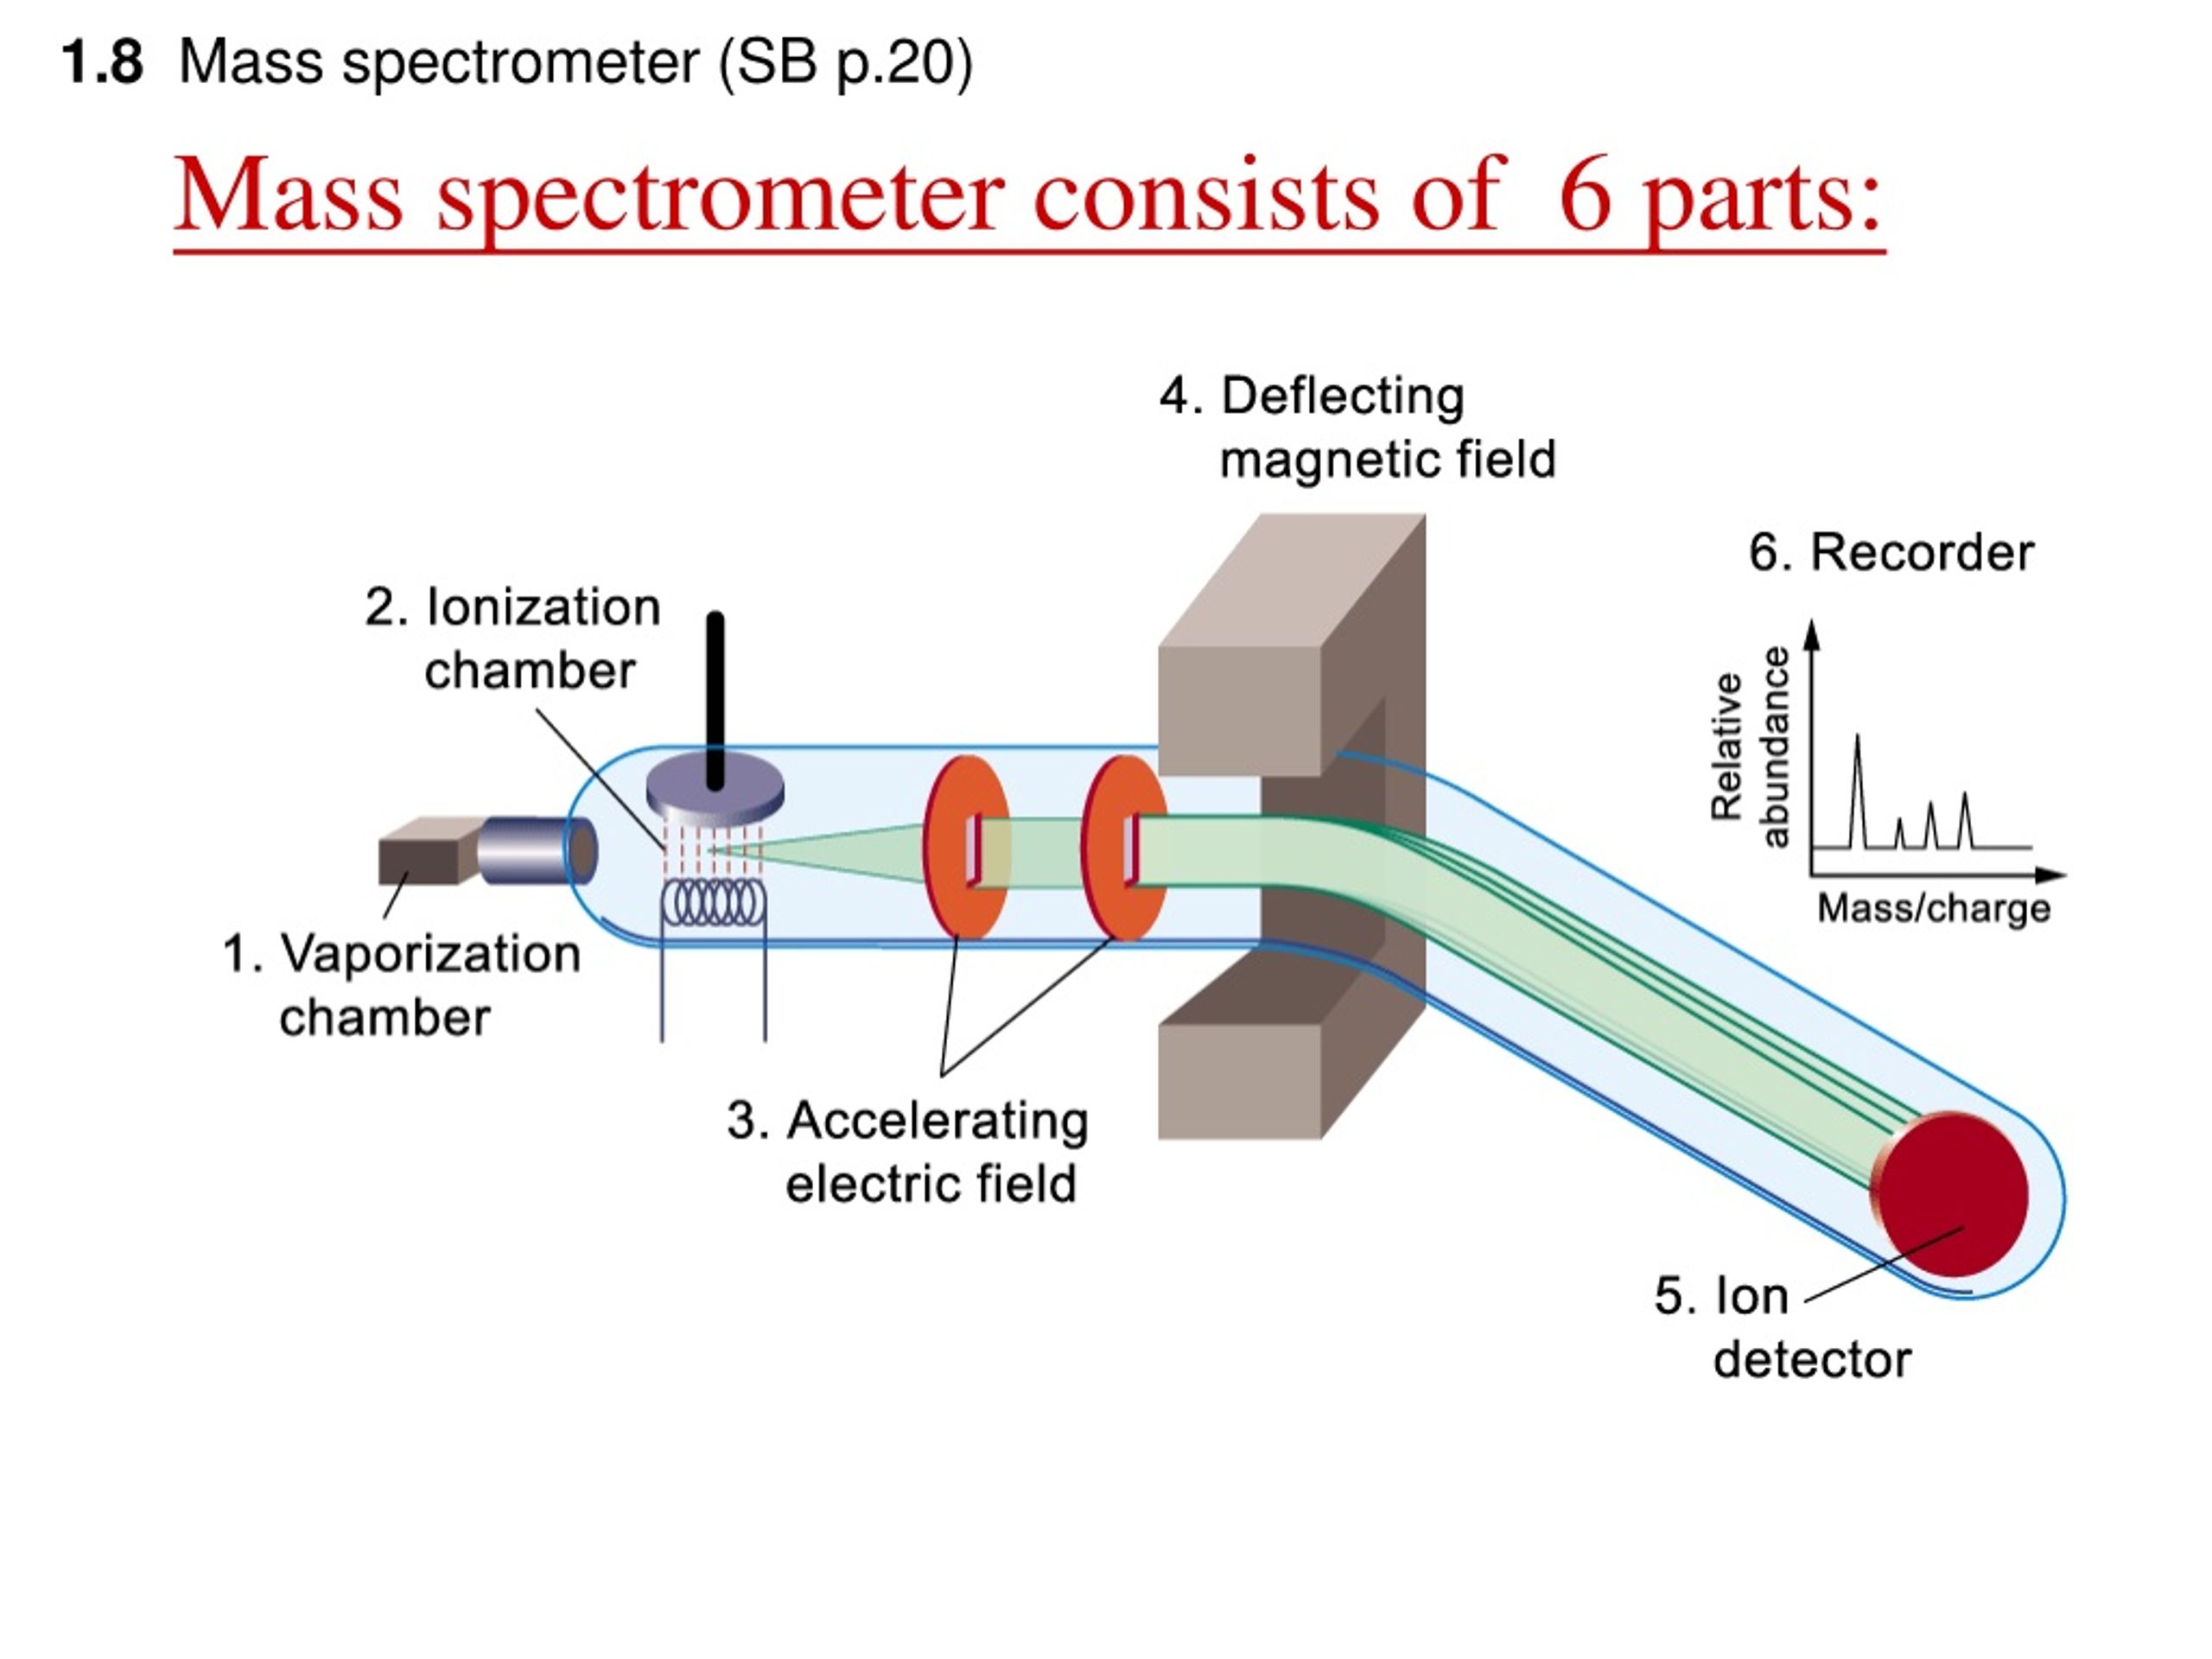
Draw A Well Labeled Diagram Of Mass Spectrometer at Herman Stpierre blog
Diagram Of Mass Spectrometer _ Mass Analyzers (Mass Spectrometry) – WCGG
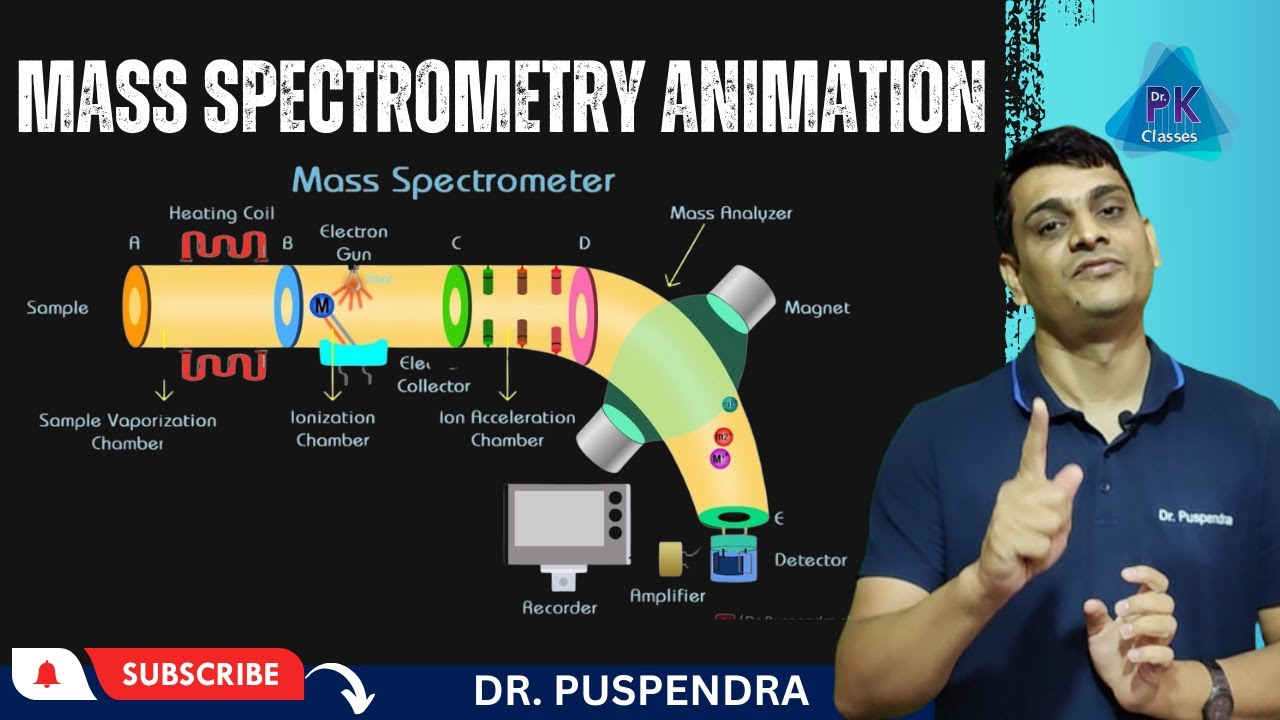
Diagram Of Mass Spectrometer _ Mass Analyzers (Mass Spectrometry) – WCGG
Mass Spectrometry: Know Its Principle, Working, Advantages & Uses

Mass Spectrometry: Know its Principle, Working, Advantages & Uses
Mass Spectrometer Schematic 15.9.1: More Fragmentation Chemistry
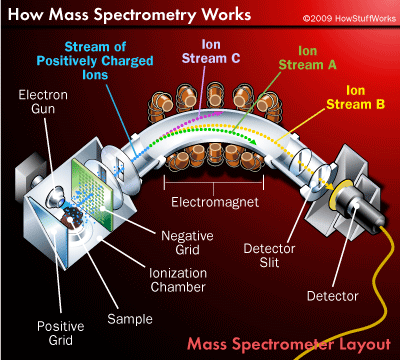
Mass Spectrometer Schematic 15.9.1: More Fragmentation Chemistry
Schematic Diagram Of A Mass Spectrometer. | Download Scientific Diagram

Schematic diagram of a Mass Spectrometer. | Download Scientific Diagram
Schematic Diagram Of A Mass Spectrometer

Schematic Diagram Of A Mass Spectrometer
Spectrometer Diagram

Spectrometer Diagram
4.3: Mass Spectrometry - Chemistry LibreTexts
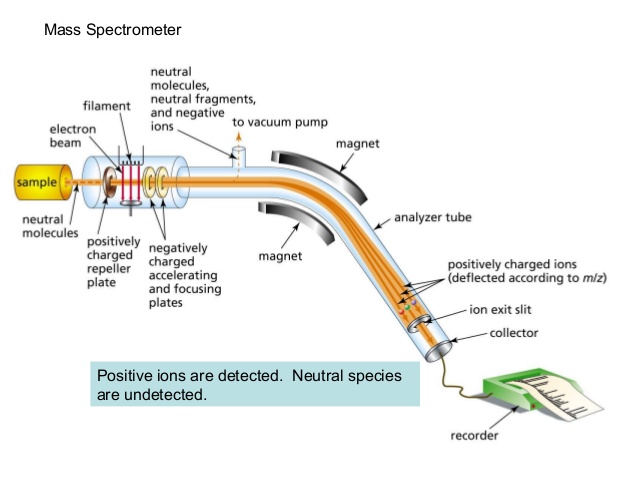
4.3: Mass Spectrometry - Chemistry LibreTexts
Schematic Diagram Of Mass Spectroscopy Pdf
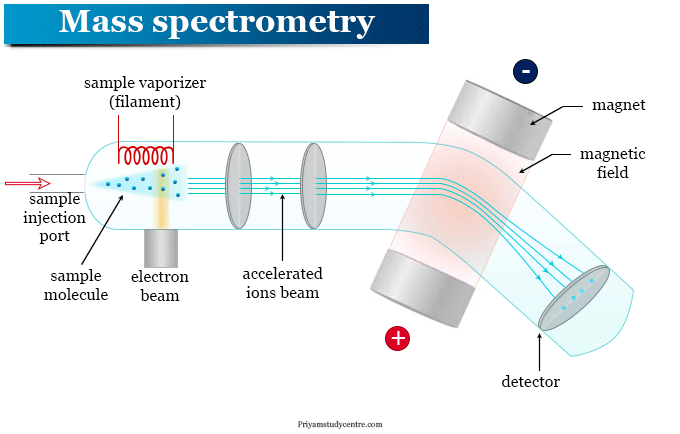
Schematic Diagram Of Mass Spectroscopy Pdf
Mass Spectrometry 1 _ A Beginner’s Guide To Mass Spectrometry – GZVZU
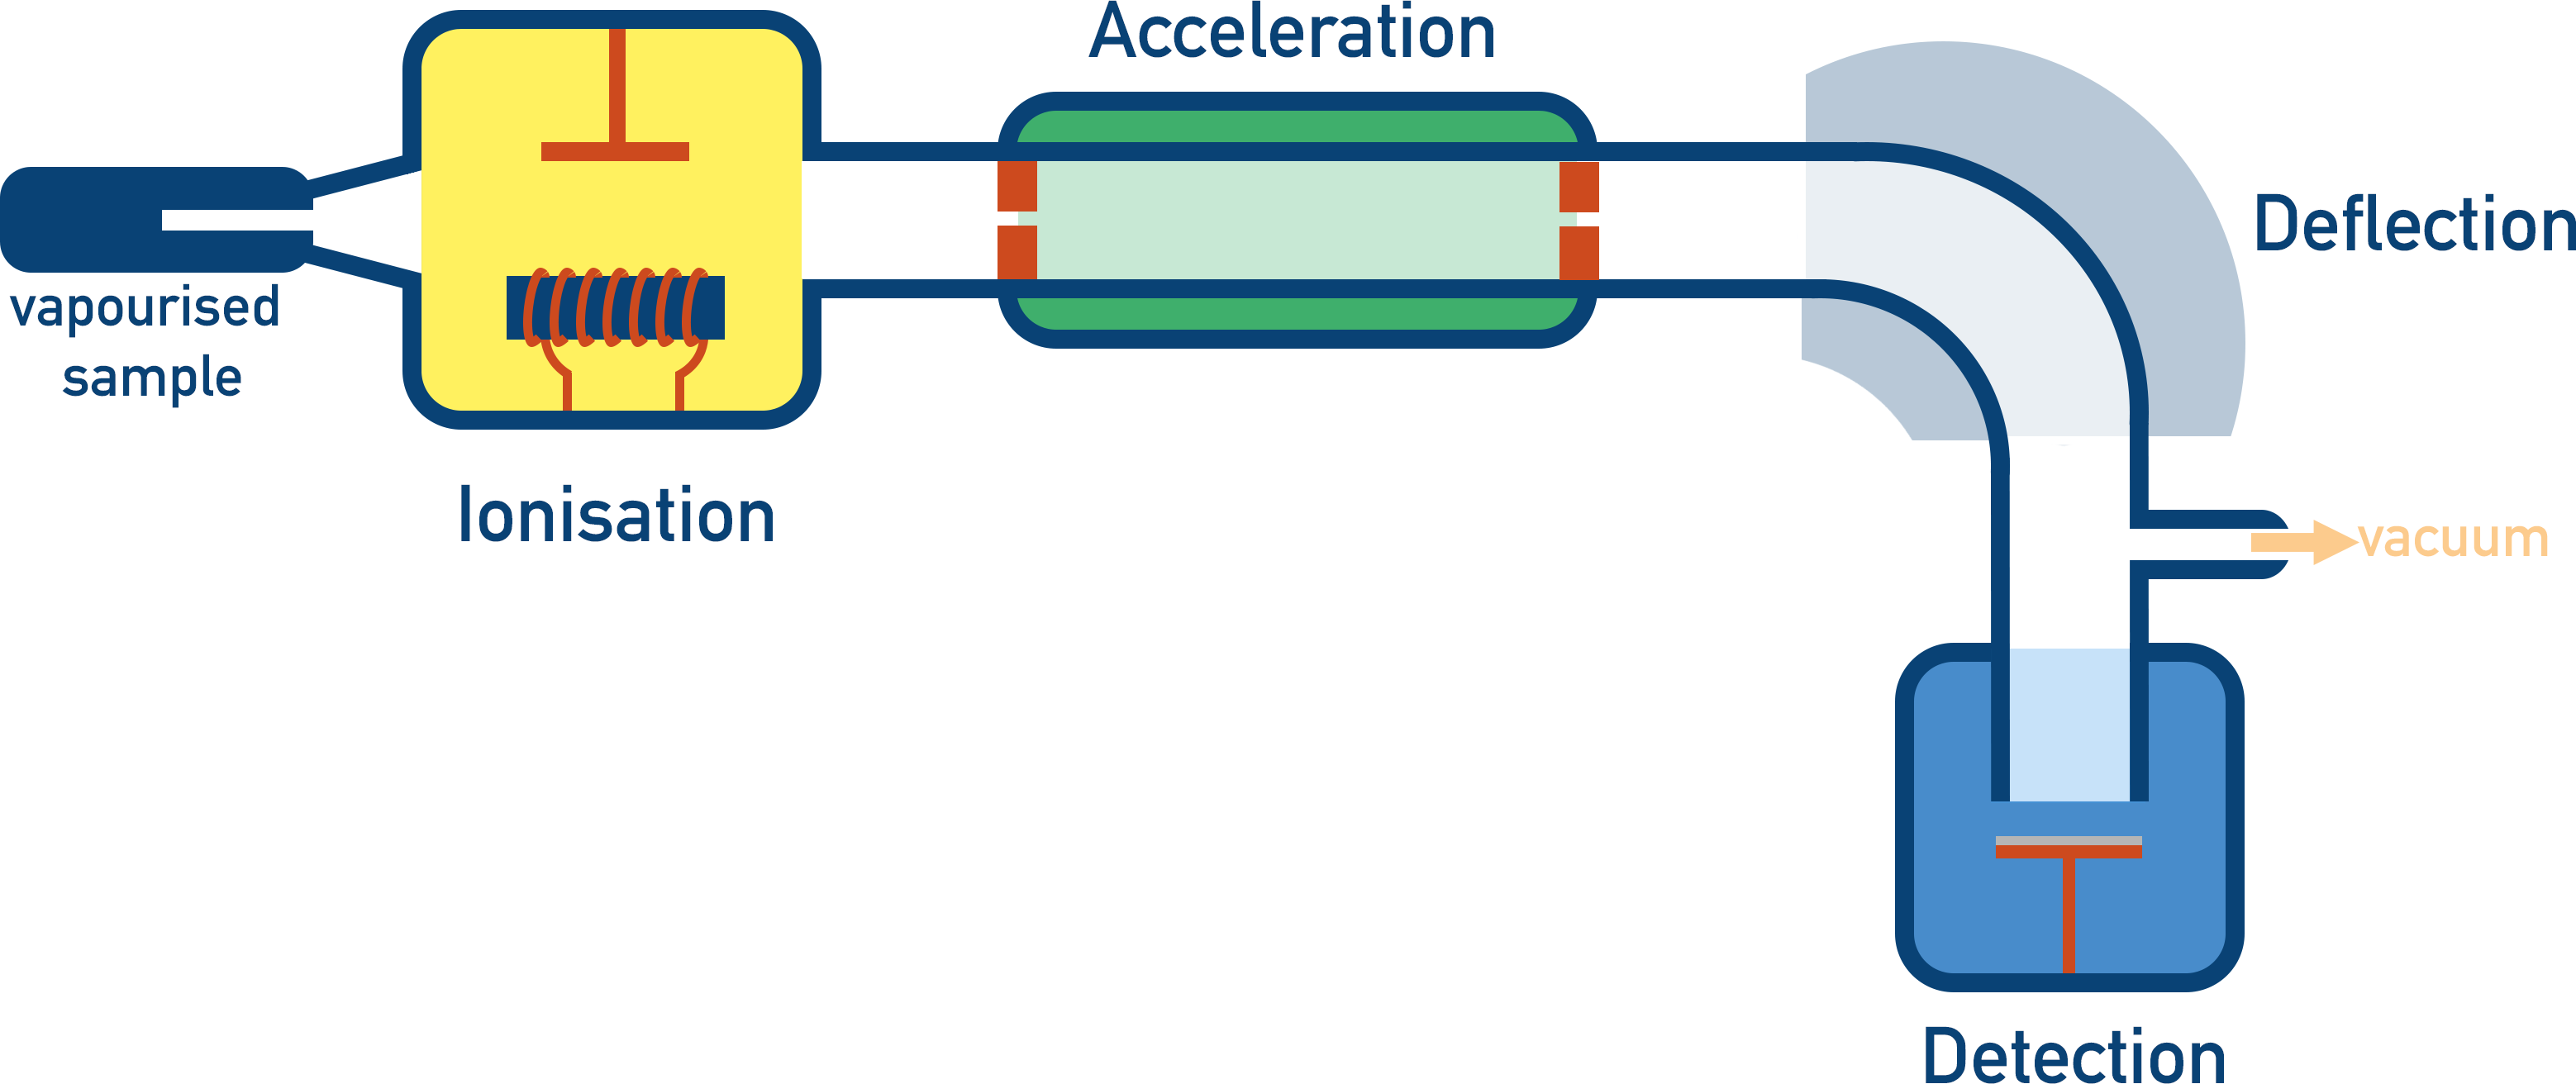
Mass Spectrometry 1 _ A beginner’s guide to mass spectrometry – GZVZU
Mass Spectrometer Diagram And Explanation At Virginia Ertel Blog
Mass Spectrometer Diagram And Explanation at Virginia Ertel blog
Draw A Well Labeled Diagram Of Mass Spectrometer At Herman Stpierre Blog
Draw A Well Labeled Diagram Of Mass Spectrometer at Herman Stpierre blog
Mass Spectrometry: Definition, Principle, And Applications

Mass Spectrometry: Definition, Principle, and Applications
14: Schematic Diagram Of A Mass Spectrometer. | Download Scientific Diagram

14: Schematic diagram of a mass spectrometer. | Download Scientific Diagram
Uses Of Mass Spectrometry _ Exploring Mass Spectrometry: Principles And

Uses Of Mass Spectrometry _ Exploring Mass Spectrometry: Principles and ...
Mass Spectrometry And Ionization Techniques

Mass spectrometry and ionization techniques
Mass Spectrometry Instrumentation Diagram At Donald Mccann Blog
Mass Spectrometry Instrumentation Diagram at Donald Mccann blog
Frontiers | Membrane Inlet Mass Spectrometry: A Powerful Tool For Algal
Frontiers | Membrane Inlet Mass Spectrometry: A Powerful Tool for Algal ...
How The Mass Spectrometer Works - Chemistry LibreTexts
How the Mass Spectrometer Works - Chemistry LibreTexts
7: Full Diagram Of A Mass Spectrometer. From... | Download Scientific
7: Full diagram of a mass spectrometer. From... | Download Scientific ...
Mass Spectrometer Diagram And Explanation At Virginia Ertel Blog

Mass Spectrometer Diagram And Explanation at Virginia Ertel blog