Understanding the Diagram of Crude Oil: A Complete Guide
In this guide you will learn how to read and interpret a standard diagram of crude oil, explore the stages of fractional distillation, identify key components and their properties, and understand how visual data reflects market trends. By the end, you’ll have a solid grasp of both the technical and commercial aspects of crude oil processing.
1. Overview of Crude Oil
Crude oil is a complex mixture of hydrocarbons ranging from light gases to heavy waxy residues. Its composition varies by geographic source and geological conditions. A diagram of crude oil typically shows its physical state, typical color, and the various fractions obtained after processing.
2. Fractional Distillation Explained
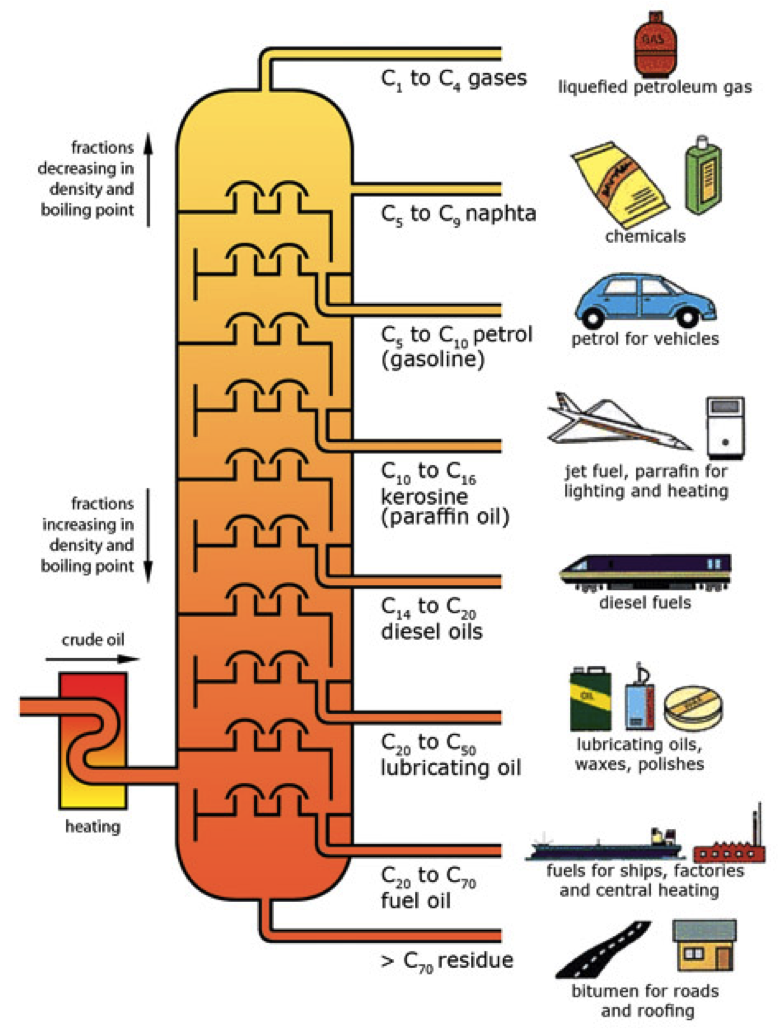
Fractional distillation is the primary method of separating crude oil into usable products. The process involves heating the oil in a distillation column, where different hydrocarbons vaporize at distinct temperatures. The column is divided into trays or plates that allow for the gradual cooling and condensation of the vapor stream.
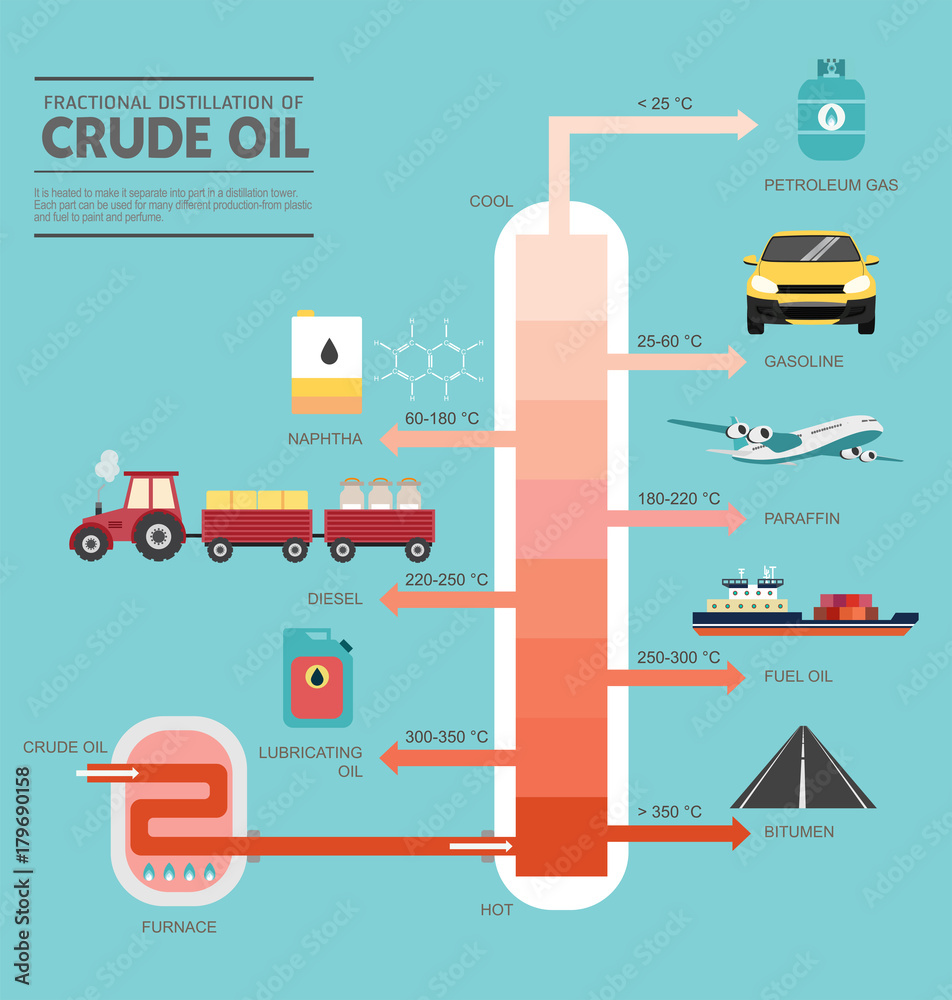
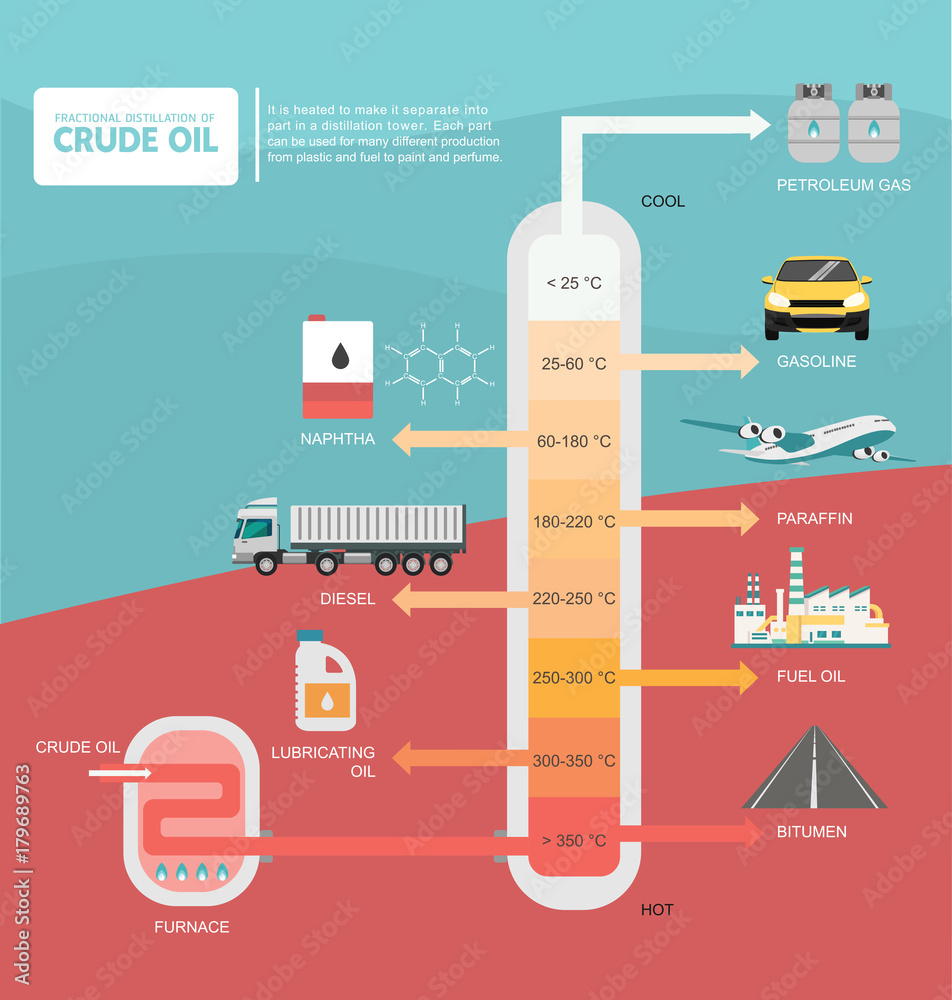
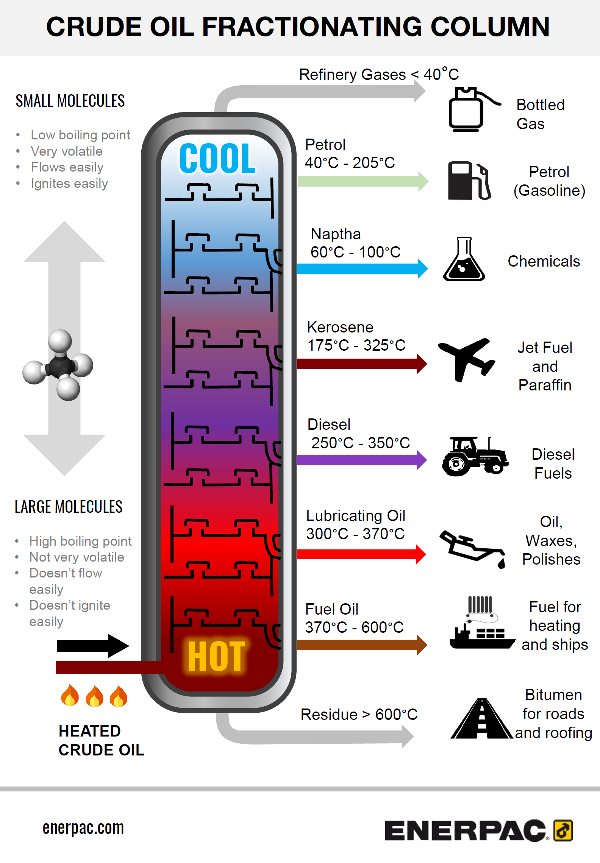
As the vapor ascends, heavier fractions condense earlier, while lighter fractions rise further. Each condensation point is collected as a product stream such as gas, gasoline, kerosene, diesel, or residual fuel oil. The diagram in the image below illustrates this separation.

Notice how the column is segmented into distinct zones, each corresponding to a product range. The temperatures at these zones are typically marked, enabling engineers to fine‑tune the process for desired yields.
3. Key Fraction Categories
Crude oil fractions are often classified by boiling range:
- Light Gasoline (LPG) – 30°C to 60°C; used as fuel for vehicles and heating.
- Gasoline – 60°C to 150°C; the main fuel for automobiles.
- Kerosene – 150°C to 250°C; used for jet fuel and household heating.
- Diesel – 250°C to 350°C; power plant and truck fuel.
- Fuel Oil – 350°C to 500°C; industrial boilers and ship engines.
- Residue – >500°C; used for asphalt or further conversion into petrochemicals.
Each fraction’s characteristics—viscosity, density, sulfur content—directly influence its end use and market value.
4. Visualizing Market Dynamics
Beyond the technical diagram, market charts provide insight into crude oil pricing trends. The second image below represents a typical market overview, showing price fluctuations over time.
Such charts help analysts, traders, and policymakers understand how supply, demand, geopolitical events, and refinery throughput affect crude oil prices. Interpreting these visual cues is essential for making informed decisions in the energy sector.
5. The Role of Refining Additives
Once crude oil reaches the refinery, additives are introduced to enhance product quality. These include:
- Sulfur reducers to meet environmental regulations.
- Stabilizers that prevent polymerization and preserve storage integrity.
- Anti-foaming agents that improve process efficiency.
Additives are often shown on refined product diagrams as separate layers, illustrating how the final fuels are composed.
6. Environmental Considerations
Crude oil refining is a significant source of greenhouse gas emissions. Modern diagrams now include carbon capture pathways and the use of renewable energy sources in the refining process. Understanding these additions is crucial for stakeholders aiming to reduce carbon footprints.
7. Common Misconceptions
Many people assume that all crude oils are the same. In reality, “light” and “heavy” crude oils differ markedly in density and sulfur content. A diagram can clarify these distinctions by labeling each fraction’s properties, preventing misinterpretation of quality and cost.
Conclusion
Diagrams of crude oil and its distillation process serve as indispensable tools for engineers, economists, and environmental scientists alike. They translate complex hydrocarbon chemistry into accessible visual information, enabling accurate interpretation of product yields, market trends, and regulatory impacts. By mastering these visual guides, professionals can better predict refinery outputs, navigate market fluctuations, and contribute to cleaner energy solutions.
Fractional Distillation Of Crude Oil Diagram Stock Vector

Fractional Distillation of Crude Oil Diagram Stock Vector ...
Fractional Distillation Of Oil Hi-res Stock Photography And Images - Alamy

Fractional distillation of oil hi-res stock photography and images - Alamy
Fractional Distillation Of Crude Oil Diagram Stock Vector

Fractional Distillation of Crude Oil Diagram Stock Vector ...
Fractional Distillation Diagram Fractional Distillation Of Crude Oil

Fractional Distillation Diagram Fractional Distillation Of Crude Oil
Fractional Distillation Of Crude Oil Diagram Infographic Design

Fractional Distillation Of Crude Oil Diagram Infographic Design ...
Fractional Distillation Crude Oil Diagram Illustration Stock Vector

Fractional Distillation Crude Oil Diagram Illustration Stock Vector ...
Fractional Distillation Of Crude Oil Diagram High-Res Vector Graphic

Fractional Distillation Of Crude Oil Diagram High-Res Vector Graphic ...
Crude Oil Fractional Distillation Diagram Vector Image

Crude Oil Fractional Distillation Diagram Vector Image
Fractional Distillation Of Crude Oil Diagram Stock Illustration

Fractional Distillation Of Crude Oil Diagram Stock Illustration ...
Fractional Distillation Crude Oil Diagram Illustration Stock Vector

Fractional Distillation Crude Oil Diagram Illustration Stock Vector ...
Diagram Showing Fractional Distillation Crude Oil Stock Vector Image

Diagram showing fractional distillation crude oil Stock Vector Image ...
Diagram Showing Fractional Distillation Crude Oil Stock Vector Image

Diagram showing fractional distillation crude oil Stock Vector Image ...
Fractional Distillation Of Crude Oil Diagram Stock Vector | Adobe Stock
Fractional distillation of crude oil diagram Stock Vector | Adobe Stock
Fractional Distillation Diagram Fractional Distillation Of Crude Oil

Fractional Distillation Diagram Fractional Distillation Of Crude Oil
Crude Oil Diagram

Crude Oil Diagram
Fractional Distillation Of Crude Oil Vector Illustration 18891997

fractional distillation of crude oil vector illustration 18891997 ...
Fractional Distillation Of Crude Oil Diagram Stock Vector | Adobe Stock
Fractional distillation of crude oil diagram Stock Vector | Adobe Stock
Fractional Distillation Of Crude Oil Labeled Educational Explanation

Fractional Distillation Of Crude Oil Labeled Educational Explanation ...
Fractional Distillation Of Crude Oil Diagram High-Res Vector Graphic

Fractional Distillation Of Crude Oil Diagram High-Res Vector Graphic ...
Fractional Distillation Of Crude Oil 500x490
Fractional Distillation Of Crude Oil 500x490
Petroleum Oil Diagram Chapter_1

Petroleum Oil Diagram Chapter_1
Fractional Distillation Of Crude Oil Diagram Stock Vector | Adobe Stock

Fractional distillation of crude oil diagram Stock Vector | Adobe Stock
Crude Oil Refinery Process, Showing Fractional Distillation In A Column
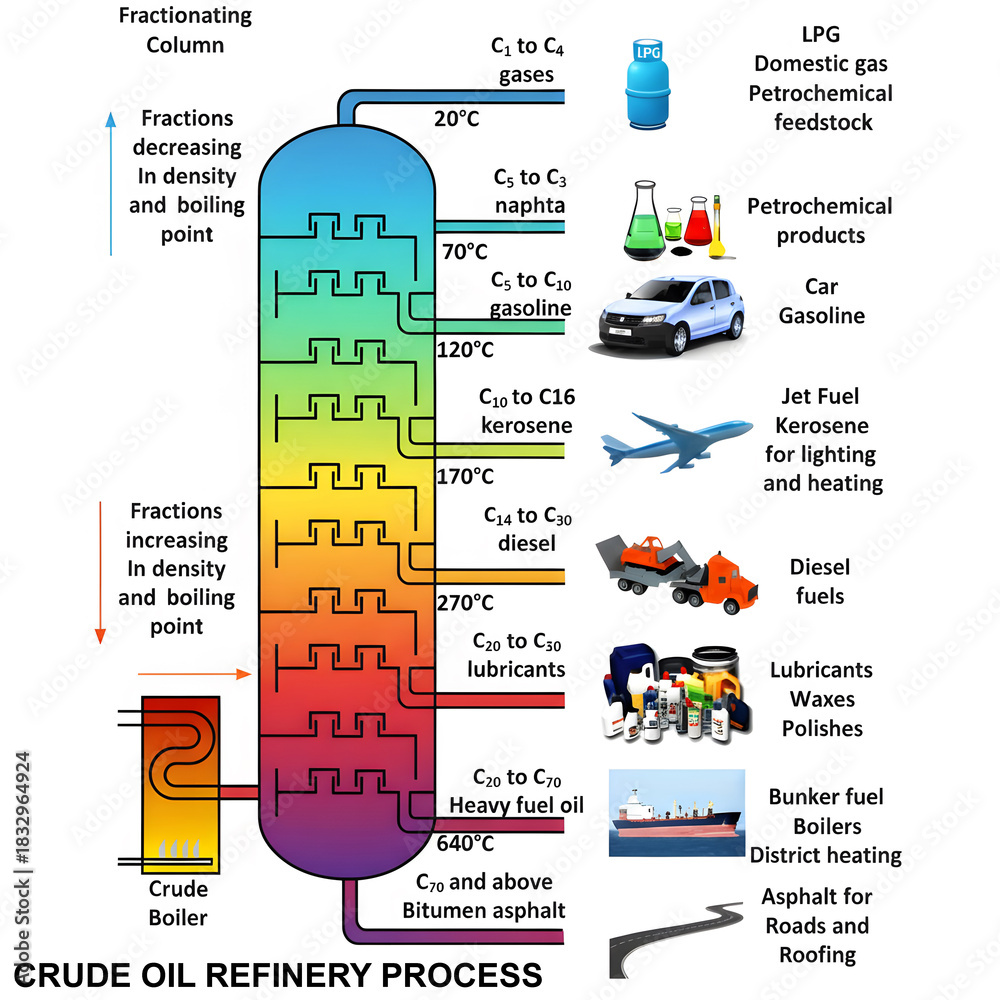
Crude Oil Refinery Process, showing fractional distillation in a column ...
Fractional Distillation Of Crude Oil Diagram High-Res Vector Graphic

Fractional Distillation Of Crude Oil Diagram High-Res Vector Graphic ...
Fractional Distillation Of Crude Oil Diagram Stock Vector

Fractional Distillation of Crude Oil Diagram Stock Vector ...